
Geopolitics
Are America’s Tariffs Here to Stay? One Year Into Trump’s Second Term

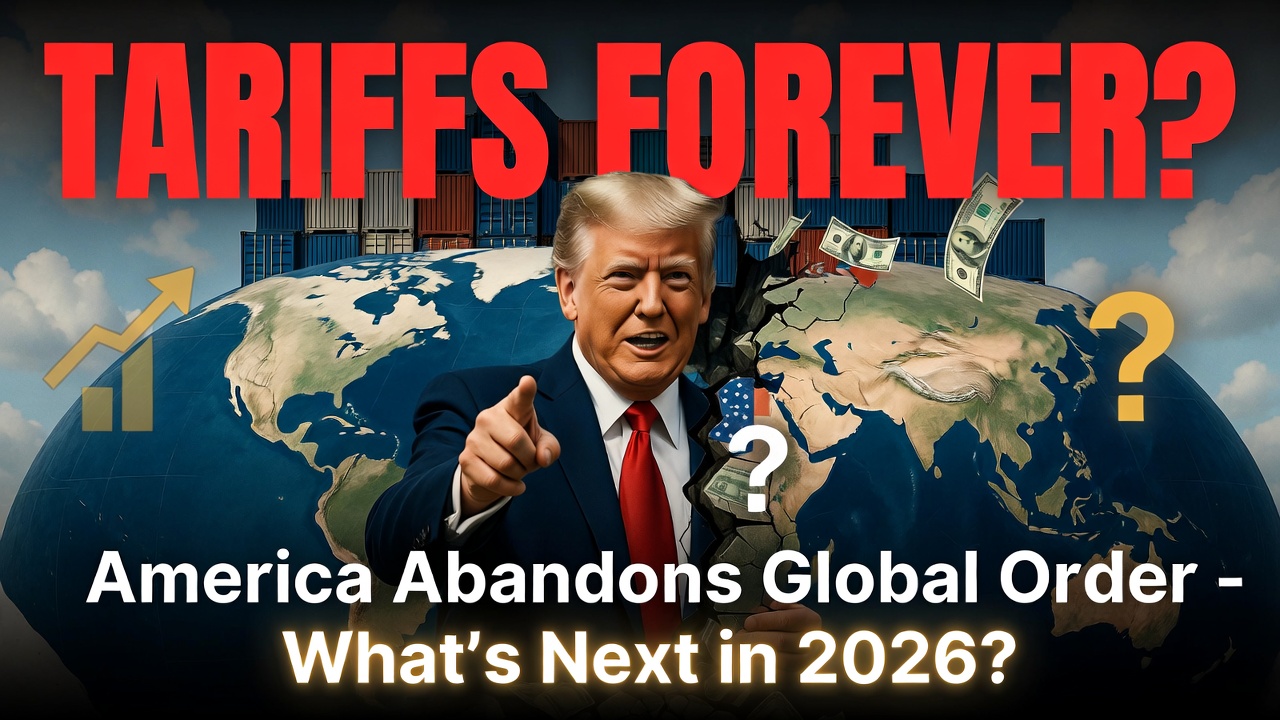
One year into President Donald Trump’s second term, the landscape of global trade has undergone a profound transformation. The United States, long the steward of the post-1945 liberal economic order, has pivoted decisively toward a protectionist stance. Tariffs—once deployed selectively—have become a central instrument of economic statecraft, applied broadly to adversaries and allies alike. Average effective tariff rates have risen to levels not seen in over a century, generating substantial federal revenue while prompting retaliatory measures, supply-chain reconfiguration, and heightened geopolitical friction.
Policymakers, researchers, and think tank analysts now confront a pivotal question: are Trump tariffs permanent, or do they represent negotiable leverage that could recede with shifting political or economic pressures? As of mid-January 2026, the evidence points toward entrenchment, though important caveats remain.
Are America’s Tariffs Here to Stay? A Preliminary Assessment
The short answer is yes, in substantial part—with meaningful qualifications. Indicators strongly suggest that many of Trump’s second-term tariffs are likely to endure beyond the current administration:
- Fiscal entrenchment — Tariff revenue has emerged as a significant budgetary resource, with collections exceeding $133 billion under IEEPA-based measures alone through late 2025 .
- Bipartisan acceptance of China-specific measures — Restrictions on Chinese imports enjoy broad support across the U.S. political spectrum and are increasingly viewed as permanent features of national security policy .
- Legal and institutional path dependence — Once imposed under executive authorities like the International Emergency Economic Powers Act (IEEPA), tariffs create domestic constituencies—protected industries and revenue-dependent programs—that resist rollback .
- Geopolitical recalibration — The tariffs signal a lasting shift toward “America First” realism, prioritizing bilateral deals over multilateral rules .
Countervailing risks include ongoing Supreme Court litigation over IEEPA’s scope . What’s striking is how quickly tariffs have moved from campaign rhetoric to structural reality.

The Evolution of Tariffs in Trump’s Second Term
Trump’s second-term trade policy builds on—but dramatically expands—first-term actions. Where Section 301 and Section 232 authorities dominated previously, the administration has leaned heavily on IEEPA to justify sweeping measures .
Legal Foundations and IEEPA Expansion
In early 2025, President Trump invoked IEEPA to declare national emergencies tied to trade deficits, fentanyl inflows, and unfair practices, enabling broad tariff implementation .
Key Tariff Actions by Country and Issue
The administration has calibrated tariffs variably:
| Trading Partner/Issue | Initial Rate (2025) | Current Rate (Jan 2026) | Rationale & Status |
|---|---|---|---|
| China | Up to 60-145% on many goods | High rates persist with some adjustments | National security, fentanyl, trade practices; partial deals in place |
| Canada & Mexico | 25% on select goods | Largely moderated after negotiations | Migration and fentanyl; most trade under USMCA exemptions |
| European Union | Reciprocal + additional layers | Reduced in some sectors post-talks | Trade imbalances |
| Countries trading with Iran | 25% additional | Active secondary measures | Pressure on Iran |
| Global baseline | 10-20% universal/reciprocal | Partial exemptions remain | Persistent deficits |
These actions reflect a strategic blend of punishment and leverage .
Economic Impacts: Revenue Gains Versus Broader Costs
The most immediate outcome has been revenue. Customs duties have reached historic highs, with projections of sustained hundreds of billions annually .
Revenue Projections (Selected Estimates)
Yet costs are nontrivial. Economists note higher consumer prices and regressive impacts .
Geopolitical Consequences: Reshaping Alliances and Global Order
The tariffs have accelerated fragmentation of the rules-based system. Allies are diversifying ties, while adversaries adapt .
The Iran-related secondary tariffs exemplify broader economic coercion .
Key Indicators of Permanence
Several factors favor longevity:
- Revenue dependence — Hard to forgo sustained fiscal inflows .
- National security framing — Especially versus China .
- Domestic winners — Protected sectors investing in capacity .
- Precedent — Fallback authorities beyond IEEPA .
Potential Counterforces and Risks
Challenges include Supreme Court review .
Implications for the Global Economic Order
Permanent elevated tariffs would cement fragmentation, with higher costs and bifurcated chains .
Policy Recommendations for Stakeholders
- U.S. policymakers — Complement tariffs with industrial incentives.
- Allied governments — Accelerate diversification .
- Corporations — Build resilience.
- Researchers — Study long-term distributional and comparative effects.
In conclusion, while adjustments are likely, the core of Trump’s second-term tariffs appears structurally entrenched. This economic nationalism offers fiscal and strategic payoffs—but substantial risks. Navigating it will shape global governance for decades.
References
Brookings Institution. (n.d.). Back to the brink: North American trade in the 2nd Trump administration. https://www.brookings.edu/articles/back-to-the-brink-north-american-trade-in-the-2nd-trump-administration
Brookings Institution. (n.d.). Key takeaways on Trump’s reciprocal tariffs from recent Brookings event. https://www.brookings.edu/articles/key-takeaways-on-trumps-reciprocal-tariffs-from-recent-brookings-event
Brookings Institution. (n.d.). Recent tariffs threaten residential construction. https://www.brookings.edu/articles/recent-tariffs-threaten-residential-construction
Brookings Institution. (n.d.). Tariffs are a particularly bad way to raise revenue. https://www.brookings.edu/articles/tariffs-are-a-particularly-bad-way-raise-revenue
Brookings Institution. (n.d.). Trump’s 25% tariffs on Canada and Mexico will be a blow to all 3 economies. https://www.brookings.edu/articles/trumps-25-tariffs-on-canada-and-mexico-will-be-a-blow-to-all-3-economies
Council on Foreign Relations. (n.d.). National security costs of Trump’s tariffs. https://www.cfr.org/article/national-security-costs-trumps-tariffs
Council on Foreign Relations. (n.d.). Tariffs on trading partners: What can the president actually do? https://www.cfr.org/report/tariffs-trading-partners-can-president-actually-do
Council on Foreign Relations. (n.d.). Trade trends to watch 2026. https://www.cfr.org/article/trade-trends-watch-2026
Council on Foreign Relations. (n.d.). Trump imposes new Iran tariffs. https://www.cfr.org/article/trump-imposes-new-iran-tariffs
Council on Foreign Relations. (n.d.). Trump’s new tariff announcements. https://www.cfr.org/article/trumps-new-tariff-announcements
Foreign Affairs. (n.d.). America needs economic warriors. https://www.foreignaffairs.com/united-states/america-needs-economic-warriors
Foreign Affairs. (n.d.). The case for a grand bargain between America and China. https://www.foreignaffairs.com/united-states/case-grand-bargain-between-america-and-china
Foreign Affairs. (n.d.). How Europe lost. https://www.foreignaffairs.com/united-states/how-europe-lost-matthijs-tocci
Foreign Affairs. (n.d.). How multilateralism can survive. https://www.foreignaffairs.com/south-america/how-multilateralism-can-survive
Foreign Affairs. (n.d.). The new supply chain insecurity. https://www.foreignaffairs.com/united-states/new-supply-chain-insecurity-shannon-oneil
Reuters. (2026, January 6). U.S. tariffs that are at risk of court-ordered refunds exceed $133.5 billion. https://www.reuters.com/world/us/us-tariffs-that-are-risk-court-ordered-refunds-exceed-1335-billion-2026-01-06
Reuters. (2026, January 8). Importers brace for $150 billion tariff refund fight if Trump loses Supreme Court. https://www.reuters.com/legal/government/importers-brace-150-billion-tariff-refund-fight-if-trump-loses-supreme-court-2026-01-08
Reuters. (2026, January 8). Market risk mounts as Supreme Court weighs Trump’s emergency tariff powers. https://www.reuters.com/legal/government/market-risk-mounts-supreme-court-weighs-trumps-emergency-tariff-powers-2026-01-08
Tax Foundation. (n.d.). IEEPA tariff revenue, Trump, debt, economy. https://taxfoundation.org/blog/ieepa-tariff-revenue-trump-debt-economy
Tax Foundation. (n.d.). Trump tariffs revenue estimates. https://taxfoundation.org/blog/trump-tariffs-revenue-estimates
Tax Foundation. (n.d.). Trump tariffs: The economic impact of the Trump trade war. https://taxfoundation.org/research/all/federal/trump-tariffs-trade-war
Tax Foundation. (n.d.). Universal tariff revenue estimates. https://taxfoundation.org/research/all/federal/universal-tariff-revenue-estimates
The Economist. (2025, November 12). America is going through a big economic experiment. https://www.economist.com/the-world-ahead/2025/11/12/america-is-going-through-a-big-economic-experiment
The Economist. (2025, November 12). Global trade will continue but will become more complex. https://www.economist.com/the-world-ahead/2025/11/12/global-trade-will-continue-but-will-become-more-complex
The Economist. (2026, January 6). America’s missing manufacturing renaissance. https://www.economist.com/finance-and-economics/2026/01/06/americas-missing-manufacturing-renaissance
The Economist. (2026, January 8). Do not mistake a resilient global economy for populist success. https://www.economist.com/leaders/2026/01/08/do-not-mistake-a-resilient-global-economy-for-populist-success
The Economist. (n.d.). Are America’s tariffs here to stay? https://www.economist.com/insider/inside-geopolitics/are-americas-tariffs-here-to-stay
The New York Times. (2026, January 3). Trump tariffs prices impact. https://www.nytimes.com/2026/01/03/business/economy/trump-tariffs-prices-impact.html
The New York Times. (2026, January 13). China trade surplus exports. https://www.nytimes.com/2026/01/13/business/china-trade-surplus-exports.html
The New York Times. (2026, January 13). Trump Iran tariffs trade. https://www.nytimes.com/2026/01/13/world/middleeast/trump-iran-tariffs-trade.html
The New York Times. (2026, January 14). Trump tariffs economists. https://www.nytimes.com/2026/01/14/us/politics/trump-tariffs-economists.html
The Wall Street Journal. (n.d.). Trump predicts strong economic growth in 2026 during speech in Detroit. https://www.wsj.com/politics/policy/trump-predicts-strong-economic-growth-in-2026-during-speech-in-detroit-71a5a19d
The Wall Street Journal. (n.d.). What to know about Trump’s latest tariff policy moves. https://www.wsj.com/economy/trade/what-to-know-about-trumps-latest-tariff-policy-moves-8d9f8b37
BBC News. (n.d.). Article on Trump tariffs and global trade. https://www.bbc.com/news/articles/cwynx4rerpzo
BBC News. (n.d.). Article on Trump tariffs economic effects. https://www.bbc.com/news/articles/czejp3gep63o








Online interest in impeachment and White House staffing has risen in a political environment where a few words can badly distort the underlying story. A resolution was introduced is not the same as the House voted to impeach. A press secretary was removed is not the same as the administration changed policy. Both require evidence, dates and clear procedural language.
Two verifiable developments frame the discussion as of October 25, 2026. A House impeachment resolution was tabled on September 15, and the short tenure of White House press secretary Katie Zacharia ended in mid-October, according to official congressional records and major US reporting. Neither event should be inflated into an unverified claim about new votes or a new administration decision.
The impeachment resolution: what the House actually voted on
House Resolution 1486 concerned impeachment of President Donald Trump. The US House’s official floor summary records the September 15 vote on a motion to table the measure: 232–147, with 47 members recorded as present. A successful tabling motion sets aside a measure; it is not the adoption of articles of impeachment.
This distinction is essential. A social post describing that roll call as a vote to impeach reverses the outcome. A later claim about a different resolution should be separately checked against the official Congress website and House roll-call records rather than treated as an update to an old headline without evidence.
Congressional procedure is sometimes inconvenient for trending-content production. It is also what protects the reader from misinformation. The reporter’s task is to identify the motion, the chamber, the date and the disposition before attempting broader political interpretation.
What happened to the press secretary?
CBS News reported on October 16 that Zacharia was removed from the White House press-secretary role after roughly five days. CBS cited US officials and reported scrutiny of her credentials and performance. It also noted that the White House had not yet announced a successor in that report.
A leadership change in the briefing room can be significant for how an administration communicates with journalists and the public. But personnel turnover alone does not establish a change to economic policy, foreign strategy or legal proceedings. Those substantive conclusions require separate evidence.
Why the two stories became combustible
Impeachment is a constitutionally consequential process and a powerful political symbol. White House press briefings are the main arena where officials defend decisions under questioning. When both topics circulate at once, online narratives may stitch them into a supposed constitutional crisis—even if there is no documented direct connection.
A measured account must resist that temptation. Political opponents may view impeachment proposals as necessary oversight; supporters of the president may describe them as partisan exercises. The purpose of reporting is not to resolve those disagreements by advocacy, but to distinguish political argument from verifiable institutional action.
The fact-checker’s four-part test
| Question | Evidence needed |
|---|---|
| Was an impeachment measure introduced? | Official resolution number and introduction date |
| Did the House approve articles? | Recorded vote on adopting the relevant articles |
| Was an official removed? | Direct statement or multiple reliable attributed reports |
| Who now holds the position? | Current White House announcement, not an old biography |
This is particularly important during a midterm-election year. Campaigns and commentators have incentives to present ordinary procedural setbacks as existential victories or defeats. Readers benefit from precise language instead of ever-louder adjectives.
What should international readers take from it?
For audiences in Pakistan and elsewhere in Asia, US political turmoil matters when it alters policy certainty: trade measures, sanctions, diplomacy, defence arrangements, fiscal decisions and monetary-policy appointments. None should be projected automatically from a press secretary’s dismissal or a resolution that did not pass.
It is sensible to monitor official notices, court actions and enacted policy. It is not sensible to treat search-volume spikes as proof of truth. Search trends measure curiosity, fear and newsworthiness; they do not independently confirm the event people are typing about.
Why parliamentary verbs matter
US political coverage frequently compresses filed, referred, tabled, passed and enacted into the generic word approved. Those actions are not interchangeable. A resolution can be introduced without advancing beyond committee. A motion to table is a vote about whether the chamber will proceed, not a judgment approving the underlying allegations. A measure passed by one chamber may still require further constitutional steps.
The same precision is necessary in personnel news. A spokesperson’s announced departure, a media report citing officials and a formal appointment are different evidence levels. Where the administration has not issued a replacement notice, describing a favourite online rumour as the current officeholder is poor reporting.
Public debate about impeachment also should not be reduced to the number of search queries. Search interest can be increased by critics, supporters, confused readers or social platforms circulating an old clip. It gives no reliable denominator for public opinion. A survey with a known sample and methodology is a different kind of evidence.
The best follow-up coverage would monitor official House actions and White House releases, then connect any actual policy changes to their legal basis. That approach serves readers across the political spectrum without manufacturing a crisis.
Has the September 15 House vote impeached Trump?
No. The recorded action was a successful motion to table the resolution, not a vote approving impeachment articles.
Was Katie Zacharia removed?
Yes, CBS reported her departure from the role on October 16. Any later staffing changes should be checked directly before publication.
Do impeachment trends reveal who will win the midterms?
No. Search spikes are not representative polling or an election forecast.
The standard worth keeping: precise institutional language is not timid journalism. It is the difference between telling readers what happened and telling them what a viral headline wants them to believe.

The Pentagon rarely uses the word “unrecoverable” in an official acquisition report. It used it this August, in a Selected Acquisition Report describing the state of Boeing’s F-15EX Eagle II program — and the phrase should have every defense-sector supply chain manager, procurement officer, and B2B logistics executive paying close attention.
The core problem: a 102-day strike at Boeing’s St. Louis-area production facilities didn’t just cost the company three months of output. It broke a delivery schedule in a way the Pentagon itself now says can’t be fully undone.
The Aircraft: What the F-15EX Actually Delivers
Before the supply chain story, it’s worth understanding why the Air Force wants this jet badly enough to be publicly frustrated about delays.
The F-15EX Eagle II is the most advanced variant of the F-15 lineage ever built:
- Digital fly-by-wire flight controls and a large-area glass cockpit with touchscreen interface
- A new APG-82 AESA radar, Joint Helmet Mounted Cueing System, and EPAWSS self-defense electronic warfare suite
- Higher speed and longer range than legacy F-15 variants, with a 29,000-lb payload capacity across additional weapons stations versus older Eagles
- A per-unit flyaway cost of roughly $90–93 million, with a 30-year, 104-jet program lifecycle cost estimated at $30–35 billion — a figure that compares favorably to stealth alternatives on a pure cost basis
The Air Force has committed to replacing aging F-15C/D fleets — including 36 jets slated to permanently replace 48 legacy Eagles at Kadena Air Base, Okinawa — with the EX variant, making this as much an Indo-Pacific readiness story as a domestic manufacturing one.
The Strike: 102 Days That Broke a Production Curve
Roughly 3,000+ Boeing machinists in the St. Louis region — spanning facilities in St. Louis, St. Charles, and Mascoutah, Illinois — walked off the job on August 4, 2025. The strike didn’t end until November 13–17, 2025, a complete production halt of more than three months.
Before the walkout, Boeing’s plan was aggressive but achievable:
- Deliver a full dozen Lot 2 Eagle IIs by the end of calendar 2025
- Ramp to an assembly rate of two jets per month by early 2026
- Maintain the program’s prior track record of staying within cost, schedule, and performance baselines — with all Lot 1 aircraft already delivered on time
The strike erased that runway entirely. Then–Air Force chief of staff nominee Gen. Kenneth Wilsbach confirmed the delay in written Senate testimony well before the strike even ended, warning lawmakers that overseas deliveries — including to Kadena — would be pushed into 2026.
Why the Pentagon Called the Slip “Unrecoverable”
Here’s the detail that separates this piece from standard defense-news coverage: the August 2026 Selected Acquisition Report doesn’t just describe a delay — it describes a structural, non-recoverable schedule slip.
- Boeing’s original contract required all 12 Lot 3 jets delivered in early calendar 2026.
- Instead, only about six will arrive by year’s end.
- The report explicitly frames this shortfall as permanent — the missed units are not simply “coming later,” they represent lost production capacity the line cannot make up under current constraints.
The Real Bottleneck: Parts Shortages Compounding the Strike
This is the angle that pure aviation-hobbyist coverage tends to skip, but that matters enormously to defense-sector procurement and supply chain software buyers: the strike exposed — and worsened — a parts shortage that predates it.
- Elbit-built large-area displays and low-profile head-up displays, which give the Eagle II its signature glass cockpit, are running short.
- General Electric F110 engines, the powerplant behind the jet’s performance envelope, face their own allocation constraints.
- Collins-made ejection seat cartridges round out the list of critical, single-source components.
Stockpiled inventory built up before the strike was sufficient to cover Lot 1B production. Everything after that is exposed. The Pentagon has resorted to borrowing-and-payback arrangements with foreign military sales customers — essentially reallocating parts earmarked for allied buyers back to U.S. production lines, then repaying the debt later — just to keep the line moving. That’s not a sustainable long-term fix; it’s a stopgap that shifts risk onto allied delivery schedules instead of eliminating it.
What This Means for Defense Contractors and Suppliers
For B2B readers in the defense and aerospace supply chain space, the actionable takeaways are:
- Single-source component risk is now a headline Pentagon concern, not a theoretical one. Any supplier or integrator still running single-vendor sourcing on flight-critical components (displays, engines, ejection systems) should expect increased scrutiny — and increased opportunity for qualified second-source suppliers.
- Supply chain visibility software and multi-tier risk modeling tools are likely to see increased defense-sector procurement interest as primes try to avoid a repeat of the Elbit/GE bottleneck on other programs.
- Labor relations at unionized aerospace primes are now a directly quantifiable program risk, one the Pentagon is willing to describe in a public acquisition document. Expect this to influence how future defense contracts price in labor-disruption contingencies.
- The F-15EX buy itself may be doubling in size even as the current lots run behind — the same Selected Acquisition Report flagged new cost and schedule uncertainty tied to an expanded production run, including warnings that radar, mission computer, electronic warfare, and engine systems could become obsolete over a longer timeline, requiring a “significant redesign effort” whose full cost hasn’t yet been estimated.
What Competitors Are Missing
Most defense trade coverage of the F-15EX delays stopped reporting once the strike itself ended in November 2025. The more important story — the one buried in an August 2026 acquisition document most outlets haven’t dug into — is that the schedule damage from that strike is now classified by the Pentagon as permanent, and that a second, ongoing bottleneck (Elbit displays and GE F110 engines) means the program isn’t fully back to healthy even ten months after the picket lines came down.
Timeline at a Glance
- Aug. 4, 2025 — St. Louis strike begins
- Oct. 2025 — Wilsbach confirms delivery delays in Senate testimony
- Nov. 13–17, 2025 — Strike ends
- Nov. 26, 2025 — First post-strike F-15EX delivered (142nd Wing, Portland ANG)
- Feb. 2026 — Air Force confirms delayed Kadena Air Base deployment
- Apr.–Jun. 2026 — Boeing targets doubling production rate to two jets/month
- Aug. 2026 — Selected Acquisition Report flags “unrecoverable delays” and parts shortages
People also Ask :
Q: Why are F-15EX Eagle II deliveries delayed?
A 102-day strike at Boeing’s St. Louis-area facilities (August–November 2025) halted F-15EX production, and a 2026 Pentagon acquisition report calls the resulting schedule slip “unrecoverable” — only about six of the contracted 12 Lot 3 jets will arrive by the end of 2026 instead of all 12 in early 2026. Ongoing shortages of Elbit-built cockpit displays and GE F110 engines are compounding the delay.
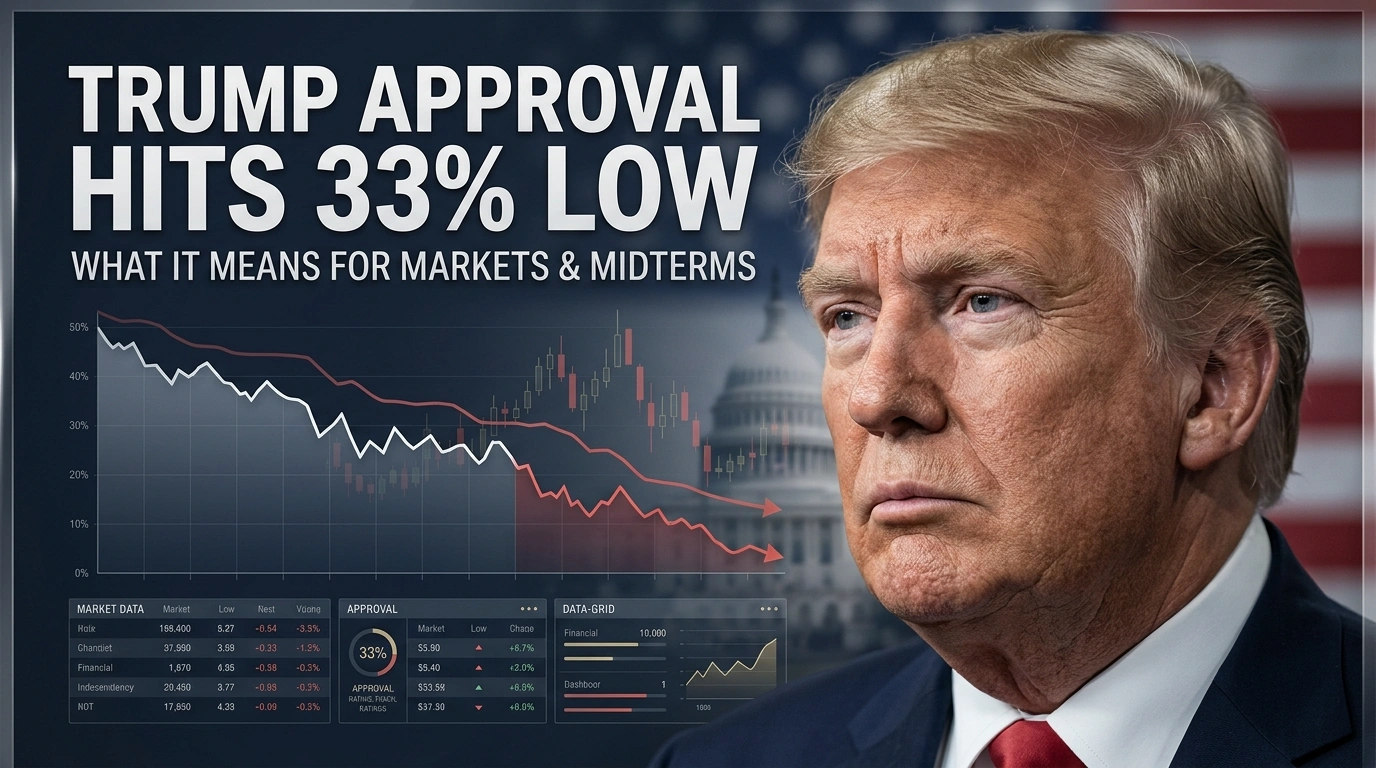
Trump’s approval rating has hit a second-term low of 33% in multiple polls this summer. Here’s what’s driving the decline, how it compares historically, and what it could mean for markets and the 2026 midterms.
Key Takeaways
- Trump’s approval rating has hit 33% in multiple independent polls this summer, including Reuters/Ipsos, The Economist/YouGov, and AP-NORC — a new low for his second term.
- The decline has been steep: Reuters/Ipsos polling shows a 14-point slide from 47% at the start of his second term to 33% now, with disapproval climbing from 41% to 65%.
- Polling averages remain somewhat higher than the lowest individual polls — the Decision Desk HQ average stood at 39.2%, illustrating the spread between different methodologies.
- The unpopular Iran conflict is a major drag: only 31% of Americans support continued U.S. military action, and 83% believe the conflict will continue for an extended period.
- Historical comparison is unfavorable: Trump’s current numbers trail his own first-term approval at the same point (41% in 2018) and are also below Biden’s comparable second-year approval (40% in August 2022).
Breaking Down the Numbers
Multiple independent polling organizations have converged on a similar, unflattering picture of President Trump’s standing heading into the 2026 midterms:
- Reuters/Ipsos: 33% approval, 65% disapproval (held steady across two consecutive surveys in mid-to-late August)
- The Economist/YouGov: 33% approval, a new low for that poll as of late August
- AP-NORC: 33% approval in a late-July survey — three points below Biden’s July 2022 approval and eight points below Trump’s own first-term July numbers
- Decision Desk HQ (DDHQ) average: 39.2%, the second-lowest since May, with 57.5% disapproving
The gap between the lowest individual polls (33%) and the polling average (around 39%) is a useful reminder for anyone tracking this story: individual polls can diverge meaningfully from methodology to methodology, and averages tend to smooth out the noise. Still, the consistent direction across virtually every major pollster — down, not up — is the more important signal than any single data point.
The Trajectory Matters as Much as the Level
According to Reuters/Ipsos tracking, Trump’s approval has fallen 14 points since the start of his second term, from 47% down to 33%, while disapproval has climbed 24 points, from 41% to 65%. That’s a significant and sustained erosion, not a single bad news cycle.
What’s Driving the Decline?
1. The Iran Conflict
An unpopular and prolonged U.S. military engagement with Iran is a significant drag on approval numbers:
- Only 31% of Americans support continued U.S. military action in Iran, down from 34% earlier in the summer and 37% in March.
- 83% of Americans believe the conflict will continue “for an extended period,” up from 80% earlier in the month — suggesting fatigue is building rather than easing.
- Approval of Trump’s handling of the Iran conflict specifically has declined even among Republicans, dropping from 71% to 61% in recent tracking, with just 48% of Republicans saying the U.S. should continue military action.
2. Economic Concerns
Polling context around the approval decline points to persistent economic anxiety among Americans as a contributing factor, compounding the foreign policy drag.
3. Historical Second-Term Pattern
Trump’s approval trajectory now trails not just his own first term, but also recent predecessors at comparable points:
| President | Approval at Comparable Point | Source |
|---|---|---|
| Trump (2026, second term) | 33% | Reuters/Ipsos |
| Trump (2018, first term, midterm year) | 41% | Reuters/Ipsos |
| Biden (August 2022) | 40% | Reuters/Ipsos |
Historical Context: What Happened Last Time Approval Was This Low Before a Midterm?
In the 2018 midterms — when Trump’s approval stood around 41%, notably higher than his current 33% — Republicans lost control of the House of Representatives, though the party gained two Senate seats. With his current approval running meaningfully below that benchmark, political analysts and Republican strategists are expressing heightened concern about the party’s ability to defend its congressional majorities in 2026.
Market and Investment Implications
Political Risk and Sector Exposure
Historically, periods of declining presidential approval heading into a midterm election can correlate with:
- Increased policy uncertainty premium in markets, particularly for sectors sensitive to potential legislative gridlock or shifts in regulatory posture.
- Elevated volatility in sectors tied to trade and foreign policy, given the Iran conflict’s direct role in the approval decline.
- Currency and bond market sensitivity to shifting expectations about fiscal policy continuity, particularly if control of Congress appears increasingly contested.
What History Suggests About Midterm-Year Market Performance
Markets have historically shown resilience through midterm election cycles regardless of which party is expected to gain seats, often pricing in political uncertainty well ahead of the actual vote. That said, sectors with direct regulatory or fiscal exposure — energy, defense, financial services, and healthcare — tend to see the most direct repricing around shifting congressional control expectations.
Actionable Takeaways for Investors and Political Observers
- Don’t overreact to a single poll. The spread between individual polls (33%) and polling averages (around 39%) illustrates why tracking multiple pollsters and trend direction matters more than any single headline number.
- Watch the Iran conflict closely as a specific, trackable driver of both approval numbers and potential market volatility — any de-escalation or further escalation is likely to move both simultaneously.
- Consider portfolio hedging strategies around sectors with direct regulatory exposure if you expect a competitive midterm environment to increase legislative gridlock risk.
- Track generic congressional ballot polling alongside presidential approval, as it offers a more direct read on likely House and Senate outcomes than approval ratings alone.
- Maintain a diversified portfolio rather than making concentrated bets based on political forecasting, given the inherent uncertainty in translating approval polling into specific electoral or market outcomes.
Frequently Asked Questions
What is Trump’s current approval rating? Multiple polls, including Reuters/Ipsos, The Economist/YouGov, and AP-NORC, have shown Trump’s approval rating at 33% as of late August 2026, while broader polling averages like Decision Desk HQ’s show a somewhat higher figure around 39%, reflecting the spread across different polling methodologies.
Why has Trump’s approval rating declined so much in 2026? Polling data points to an unpopular and prolonged U.S. military conflict with Iran, with only 31% of Americans supporting continued military action, alongside broader economic concerns, as significant contributing factors to the decline from 47% approval at the start of his second term to 33% now.
How might low presidential approval affect the stock market ahead of the midterms? Markets have historically shown general resilience through midterm election cycles, but sectors with direct regulatory or fiscal policy exposure — such as energy, defense, financial services, and healthcare — tend to experience more direct volatility around shifting expectations for congressional control, so investors may want to monitor generic ballot polling alongside approval ratings.

US Impeachment Talk and White House Press Secretary Changes: What the Record Shows

2026 Economic Outlook: Investment Tips for Pakistani Investors

Anduril’s $6.6 Billion Submarine Shipyard Plan Explained

Life Insurance Comparison: Term vs. Whole Life and What Each Actually Costs

Stock Market Today: Nasdaq Hits Record High as Dow and S&P 500 Stumble on Middle East Diplomatic Shifts

Energy Market Spikes vs. Consumer App Data: What GasBuddy and Crude Prices Signal for Inflation

China’s FTAAP Push for APEC 2026 in Shenzhen: US Tariffs and Unite Asia-Pacific

AI Stocks Slide After Industry Leaders Call for a Development Slowdown

Singapore Stocks vs. Japan Stocks: Safe Havens in the Asian Economic Slowdown

Agentic AI in Finance: How Artificial Intelligence Is Replacing Routine Tasks on Wall Street

Fiscal Deficit and Public Debt

T-Mobile’s Enterprise Push and the Evolution of Modern Corporate Mobility Solutions

Enterprise Generative AI ROI 2026: The Adoption-to-Impact Gap Explained

Climate Finance and the Economic Reality of Passing 1.5°C

Business Insurance for Digital Exports: Protecting Your Company in the AI Era

Real Estate Crash Predictions 2026: Data-Backed Regional Guide
Unrecoverable Delays: How the St. Louis Strike Crippled Boeing’s F-15EX Eagle II

What is a “Lead-Left” Bank? Unpacking Morgan Stanley’s Role in Anthropic’s Mega-IPO

How to Invest in the Anthropic IPO: Step-by-Step Guide for Retail Investors

Mario Kart 8 Deluxe 4.0.0 Patch Notes: 8-Player Split Screen & CameraPlay

Top 15 Stocks for Investment in 2026 in PSX: Your Complete Guide to Pakistan’s Best Investment Opportunities
China Economy 2026: Property Crisis, AI Investment & Export Surplus Explained

Debunking IMF Program Myths: Reconfiguring Engagement for True National Ownership in a Volatile World

Top 10 Mutual Fund Managers in Pakistan for Investment in 2026: A Comprehensive Guide for Optimal Returns

China’s 50% Domestic Equipment Rule: The Semiconductor Mandate Reshaping Global Tech

What the U.S. Attack on Venezuela Could Mean for Oil and Canadian Crude Exports: The Economic Impact

15 Most Lucrative Sectors for Investment in Pakistan: A 2025 Data-Driven Analysis

Pakistan’s Export Goldmine: 10 Game-Changing Markets Where Pakistani Businesses Are Winning Big in 2025

Pakistan’s Stock Market Renaissance: How 2025’s Hottest Investment Opportunity Is Democratizing Wealth—A Complete Beginner’s Guide
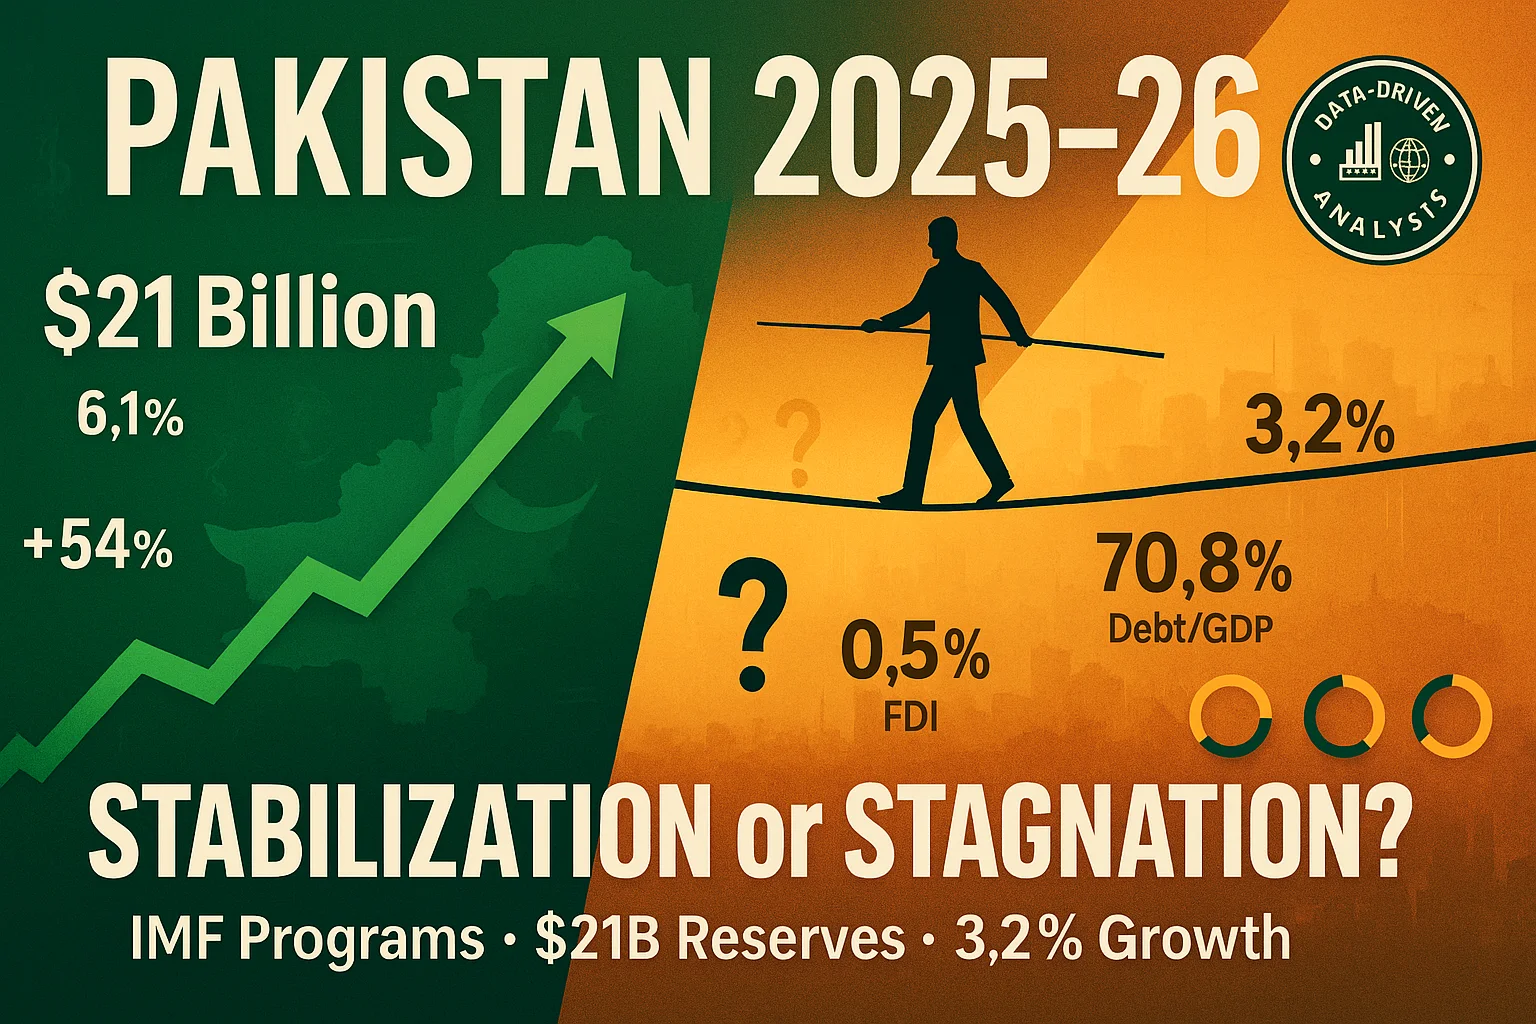
Pakistan’s Economic Outlook 2025: Between Stabilization and the Shadow of Stagnation

The Institutional Era: A Comprehensive Cryptocurrency Investment Analysis for 2026
China’s Property Woes Could Last Until 2030—Despite Beijing’s Best Censorship Efforts
Real Estate Crash Predictions 2026: Data-Backed Regional Guide

Best Investments in Pakistan 2026: Top 10 Low-Price Shares and Long-Term Picks for the PSX

How to Become an Active Taxpayer on Pakistan’s FBR Active Taxpayer List (ATL) in 2026: A Step-by-Step Guide
How to Invest in the Anthropic IPO: Step-by-Step Guide for Retail Investors

The Contours of 21st-Century Geopolitics Will Become Clearer in 2026: A New World Is Starting to Emerge
DBS Hits S$1 Billion AI Value Milestone — But Agentic AI Poses Talent Challenges for Singapore Banks

🌍 Davos 2026: The World Economic Forum Annual Meeting Sets the Stage for Global Transformation

AI Impact on Wages 2026: Productivity Soars, Paychecks Stagnate
-
Markets & Finance10 months ago
Top 15 Stocks for Investment in 2026 in PSX: Your Complete Guide to Pakistan’s Best Investment Opportunities
-
Analysis4 months ago
China Economy 2026: Property Crisis, AI Investment & Export Surplus Explained
-
Analysis9 months ago
Debunking IMF Program Myths: Reconfiguring Engagement for True National Ownership in a Volatile World
-
Investment10 months ago
Top 10 Mutual Fund Managers in Pakistan for Investment in 2026: A Comprehensive Guide for Optimal Returns
-
Asia10 months ago
China’s 50% Domestic Equipment Rule: The Semiconductor Mandate Reshaping Global Tech
-
Global Economy10 months ago
What the U.S. Attack on Venezuela Could Mean for Oil and Canadian Crude Exports: The Economic Impact
-
AI10 months ago
15 Most Lucrative Sectors for Investment in Pakistan: A 2025 Data-Driven Analysis
-
Exports10 months ago
Pakistan’s Export Goldmine: 10 Game-Changing Markets Where Pakistani Businesses Are Winning Big in 2025