
Geopolitics
Unrecoverable Delays: How the St. Louis Strike Crippled Boeing’s F-15EX Eagle II


The Pentagon rarely uses the word “unrecoverable” in an official acquisition report. It used it this August, in a Selected Acquisition Report describing the state of Boeing’s F-15EX Eagle II program — and the phrase should have every defense-sector supply chain manager, procurement officer, and B2B logistics executive paying close attention.
The core problem: a 102-day strike at Boeing’s St. Louis-area production facilities didn’t just cost the company three months of output. It broke a delivery schedule in a way the Pentagon itself now says can’t be fully undone.
The Aircraft: What the F-15EX Actually Delivers
Before the supply chain story, it’s worth understanding why the Air Force wants this jet badly enough to be publicly frustrated about delays.
The F-15EX Eagle II is the most advanced variant of the F-15 lineage ever built:
- Digital fly-by-wire flight controls and a large-area glass cockpit with touchscreen interface
- A new APG-82 AESA radar, Joint Helmet Mounted Cueing System, and EPAWSS self-defense electronic warfare suite
- Higher speed and longer range than legacy F-15 variants, with a 29,000-lb payload capacity across additional weapons stations versus older Eagles
- A per-unit flyaway cost of roughly $90–93 million, with a 30-year, 104-jet program lifecycle cost estimated at $30–35 billion — a figure that compares favorably to stealth alternatives on a pure cost basis
The Air Force has committed to replacing aging F-15C/D fleets — including 36 jets slated to permanently replace 48 legacy Eagles at Kadena Air Base, Okinawa — with the EX variant, making this as much an Indo-Pacific readiness story as a domestic manufacturing one.
The Strike: 102 Days That Broke a Production Curve
Roughly 3,000+ Boeing machinists in the St. Louis region — spanning facilities in St. Louis, St. Charles, and Mascoutah, Illinois — walked off the job on August 4, 2025. The strike didn’t end until November 13–17, 2025, a complete production halt of more than three months.
Before the walkout, Boeing’s plan was aggressive but achievable:
- Deliver a full dozen Lot 2 Eagle IIs by the end of calendar 2025
- Ramp to an assembly rate of two jets per month by early 2026
- Maintain the program’s prior track record of staying within cost, schedule, and performance baselines — with all Lot 1 aircraft already delivered on time
The strike erased that runway entirely. Then–Air Force chief of staff nominee Gen. Kenneth Wilsbach confirmed the delay in written Senate testimony well before the strike even ended, warning lawmakers that overseas deliveries — including to Kadena — would be pushed into 2026.
Why the Pentagon Called the Slip “Unrecoverable”
Here’s the detail that separates this piece from standard defense-news coverage: the August 2026 Selected Acquisition Report doesn’t just describe a delay — it describes a structural, non-recoverable schedule slip.
- Boeing’s original contract required all 12 Lot 3 jets delivered in early calendar 2026.
- Instead, only about six will arrive by year’s end.
- The report explicitly frames this shortfall as permanent — the missed units are not simply “coming later,” they represent lost production capacity the line cannot make up under current constraints.
The Real Bottleneck: Parts Shortages Compounding the Strike
This is the angle that pure aviation-hobbyist coverage tends to skip, but that matters enormously to defense-sector procurement and supply chain software buyers: the strike exposed — and worsened — a parts shortage that predates it.
- Elbit-built large-area displays and low-profile head-up displays, which give the Eagle II its signature glass cockpit, are running short.
- General Electric F110 engines, the powerplant behind the jet’s performance envelope, face their own allocation constraints.
- Collins-made ejection seat cartridges round out the list of critical, single-source components.
Stockpiled inventory built up before the strike was sufficient to cover Lot 1B production. Everything after that is exposed. The Pentagon has resorted to borrowing-and-payback arrangements with foreign military sales customers — essentially reallocating parts earmarked for allied buyers back to U.S. production lines, then repaying the debt later — just to keep the line moving. That’s not a sustainable long-term fix; it’s a stopgap that shifts risk onto allied delivery schedules instead of eliminating it.
What This Means for Defense Contractors and Suppliers
For B2B readers in the defense and aerospace supply chain space, the actionable takeaways are:
- Single-source component risk is now a headline Pentagon concern, not a theoretical one. Any supplier or integrator still running single-vendor sourcing on flight-critical components (displays, engines, ejection systems) should expect increased scrutiny — and increased opportunity for qualified second-source suppliers.
- Supply chain visibility software and multi-tier risk modeling tools are likely to see increased defense-sector procurement interest as primes try to avoid a repeat of the Elbit/GE bottleneck on other programs.
- Labor relations at unionized aerospace primes are now a directly quantifiable program risk, one the Pentagon is willing to describe in a public acquisition document. Expect this to influence how future defense contracts price in labor-disruption contingencies.
- The F-15EX buy itself may be doubling in size even as the current lots run behind — the same Selected Acquisition Report flagged new cost and schedule uncertainty tied to an expanded production run, including warnings that radar, mission computer, electronic warfare, and engine systems could become obsolete over a longer timeline, requiring a “significant redesign effort” whose full cost hasn’t yet been estimated.
What Competitors Are Missing
Most defense trade coverage of the F-15EX delays stopped reporting once the strike itself ended in November 2025. The more important story — the one buried in an August 2026 acquisition document most outlets haven’t dug into — is that the schedule damage from that strike is now classified by the Pentagon as permanent, and that a second, ongoing bottleneck (Elbit displays and GE F110 engines) means the program isn’t fully back to healthy even ten months after the picket lines came down.
Timeline at a Glance
- Aug. 4, 2025 — St. Louis strike begins
- Oct. 2025 — Wilsbach confirms delivery delays in Senate testimony
- Nov. 13–17, 2025 — Strike ends
- Nov. 26, 2025 — First post-strike F-15EX delivered (142nd Wing, Portland ANG)
- Feb. 2026 — Air Force confirms delayed Kadena Air Base deployment
- Apr.–Jun. 2026 — Boeing targets doubling production rate to two jets/month
- Aug. 2026 — Selected Acquisition Report flags “unrecoverable delays” and parts shortages
People also Ask :
Q: Why are F-15EX Eagle II deliveries delayed?
A 102-day strike at Boeing’s St. Louis-area facilities (August–November 2025) halted F-15EX production, and a 2026 Pentagon acquisition report calls the resulting schedule slip “unrecoverable” — only about six of the contracted 12 Lot 3 jets will arrive by the end of 2026 instead of all 12 in early 2026. Ongoing shortages of Elbit-built cockpit displays and GE F110 engines are compounding the delay.






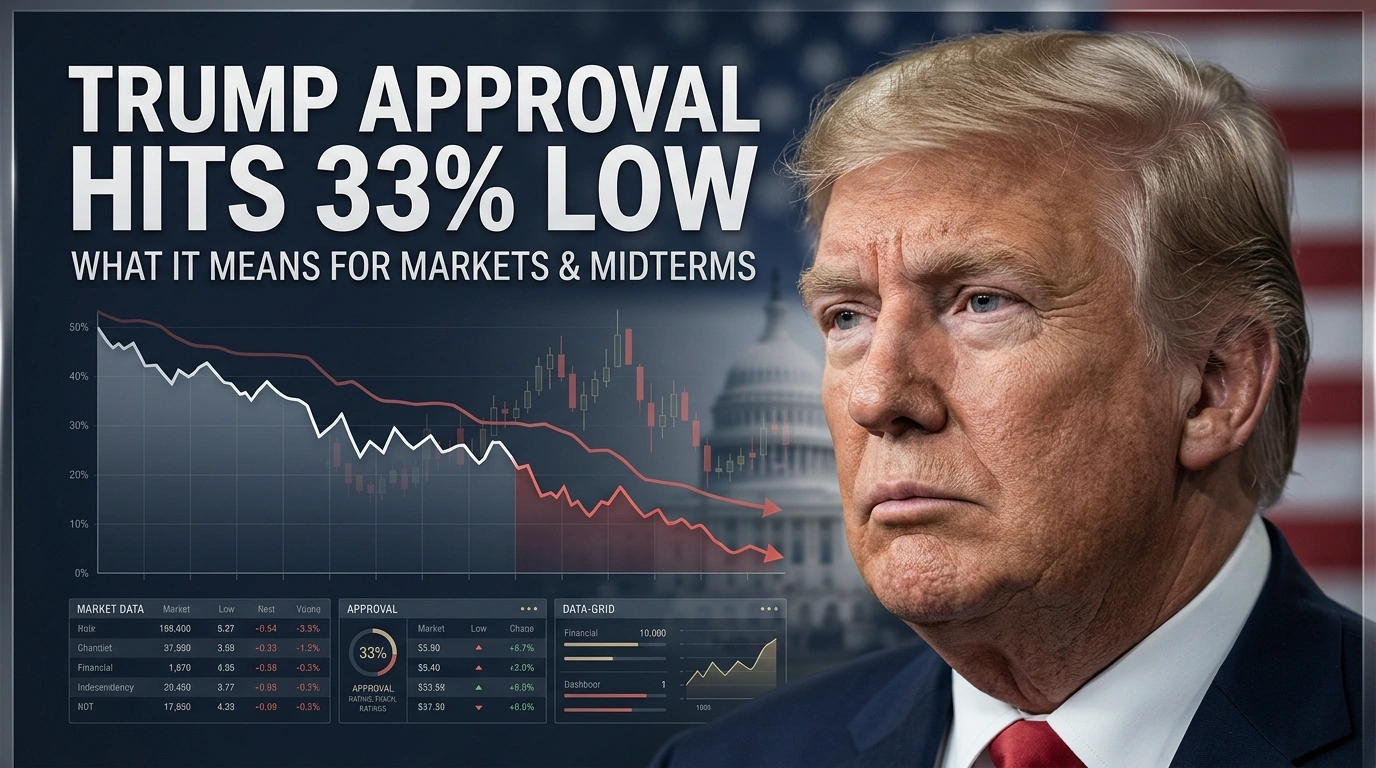
Trump’s approval rating has hit a second-term low of 33% in multiple polls this summer. Here’s what’s driving the decline, how it compares historically, and what it could mean for markets and the 2026 midterms.
Key Takeaways
- Trump’s approval rating has hit 33% in multiple independent polls this summer, including Reuters/Ipsos, The Economist/YouGov, and AP-NORC — a new low for his second term.
- The decline has been steep: Reuters/Ipsos polling shows a 14-point slide from 47% at the start of his second term to 33% now, with disapproval climbing from 41% to 65%.
- Polling averages remain somewhat higher than the lowest individual polls — the Decision Desk HQ average stood at 39.2%, illustrating the spread between different methodologies.
- The unpopular Iran conflict is a major drag: only 31% of Americans support continued U.S. military action, and 83% believe the conflict will continue for an extended period.
- Historical comparison is unfavorable: Trump’s current numbers trail his own first-term approval at the same point (41% in 2018) and are also below Biden’s comparable second-year approval (40% in August 2022).
Breaking Down the Numbers
Multiple independent polling organizations have converged on a similar, unflattering picture of President Trump’s standing heading into the 2026 midterms:
- Reuters/Ipsos: 33% approval, 65% disapproval (held steady across two consecutive surveys in mid-to-late August)
- The Economist/YouGov: 33% approval, a new low for that poll as of late August
- AP-NORC: 33% approval in a late-July survey — three points below Biden’s July 2022 approval and eight points below Trump’s own first-term July numbers
- Decision Desk HQ (DDHQ) average: 39.2%, the second-lowest since May, with 57.5% disapproving
The gap between the lowest individual polls (33%) and the polling average (around 39%) is a useful reminder for anyone tracking this story: individual polls can diverge meaningfully from methodology to methodology, and averages tend to smooth out the noise. Still, the consistent direction across virtually every major pollster — down, not up — is the more important signal than any single data point.
The Trajectory Matters as Much as the Level
According to Reuters/Ipsos tracking, Trump’s approval has fallen 14 points since the start of his second term, from 47% down to 33%, while disapproval has climbed 24 points, from 41% to 65%. That’s a significant and sustained erosion, not a single bad news cycle.
What’s Driving the Decline?
1. The Iran Conflict
An unpopular and prolonged U.S. military engagement with Iran is a significant drag on approval numbers:
- Only 31% of Americans support continued U.S. military action in Iran, down from 34% earlier in the summer and 37% in March.
- 83% of Americans believe the conflict will continue “for an extended period,” up from 80% earlier in the month — suggesting fatigue is building rather than easing.
- Approval of Trump’s handling of the Iran conflict specifically has declined even among Republicans, dropping from 71% to 61% in recent tracking, with just 48% of Republicans saying the U.S. should continue military action.
2. Economic Concerns
Polling context around the approval decline points to persistent economic anxiety among Americans as a contributing factor, compounding the foreign policy drag.
3. Historical Second-Term Pattern
Trump’s approval trajectory now trails not just his own first term, but also recent predecessors at comparable points:
| President | Approval at Comparable Point | Source |
|---|---|---|
| Trump (2026, second term) | 33% | Reuters/Ipsos |
| Trump (2018, first term, midterm year) | 41% | Reuters/Ipsos |
| Biden (August 2022) | 40% | Reuters/Ipsos |
Historical Context: What Happened Last Time Approval Was This Low Before a Midterm?
In the 2018 midterms — when Trump’s approval stood around 41%, notably higher than his current 33% — Republicans lost control of the House of Representatives, though the party gained two Senate seats. With his current approval running meaningfully below that benchmark, political analysts and Republican strategists are expressing heightened concern about the party’s ability to defend its congressional majorities in 2026.
Market and Investment Implications
Political Risk and Sector Exposure
Historically, periods of declining presidential approval heading into a midterm election can correlate with:
- Increased policy uncertainty premium in markets, particularly for sectors sensitive to potential legislative gridlock or shifts in regulatory posture.
- Elevated volatility in sectors tied to trade and foreign policy, given the Iran conflict’s direct role in the approval decline.
- Currency and bond market sensitivity to shifting expectations about fiscal policy continuity, particularly if control of Congress appears increasingly contested.
What History Suggests About Midterm-Year Market Performance
Markets have historically shown resilience through midterm election cycles regardless of which party is expected to gain seats, often pricing in political uncertainty well ahead of the actual vote. That said, sectors with direct regulatory or fiscal exposure — energy, defense, financial services, and healthcare — tend to see the most direct repricing around shifting congressional control expectations.
Actionable Takeaways for Investors and Political Observers
- Don’t overreact to a single poll. The spread between individual polls (33%) and polling averages (around 39%) illustrates why tracking multiple pollsters and trend direction matters more than any single headline number.
- Watch the Iran conflict closely as a specific, trackable driver of both approval numbers and potential market volatility — any de-escalation or further escalation is likely to move both simultaneously.
- Consider portfolio hedging strategies around sectors with direct regulatory exposure if you expect a competitive midterm environment to increase legislative gridlock risk.
- Track generic congressional ballot polling alongside presidential approval, as it offers a more direct read on likely House and Senate outcomes than approval ratings alone.
- Maintain a diversified portfolio rather than making concentrated bets based on political forecasting, given the inherent uncertainty in translating approval polling into specific electoral or market outcomes.
Frequently Asked Questions
What is Trump’s current approval rating? Multiple polls, including Reuters/Ipsos, The Economist/YouGov, and AP-NORC, have shown Trump’s approval rating at 33% as of late August 2026, while broader polling averages like Decision Desk HQ’s show a somewhat higher figure around 39%, reflecting the spread across different polling methodologies.
Why has Trump’s approval rating declined so much in 2026? Polling data points to an unpopular and prolonged U.S. military conflict with Iran, with only 31% of Americans supporting continued military action, alongside broader economic concerns, as significant contributing factors to the decline from 47% approval at the start of his second term to 33% now.
How might low presidential approval affect the stock market ahead of the midterms? Markets have historically shown general resilience through midterm election cycles, but sectors with direct regulatory or fiscal policy exposure — such as energy, defense, financial services, and healthcare — tend to experience more direct volatility around shifting expectations for congressional control, so investors may want to monitor generic ballot polling alongside approval ratings.


On a cold Tuesday morning in central Dublin, the queue outside a new residential development in Clongriffin didn’t consist of speculative investors or overseas institutional funds. Instead, it was filled with young professionals clutching pristine folders of bank statements, employment certificates, and salary clearances. This scene reflects a broader macroeconomic reality now sweeping across the state. Decades after the spectacular collapse of the Celtic Tiger, a new property milestone has arrived, though its structural drivers are fundamentally different from the loose credit environment of 2006.
The latest data reveals an unexpected trend. According to the quarterly analysis published by the Banking and Payments Federation Ireland, mortgage drawdowns for citizens entering the property market for the first time have reached their highest volume since the absolute peak of the mid-2000s property boom.
The picture is more complicated than a simple story of a booming economy. This lending surge occurs alongside a persistent housing shortage, high building material costs, and ECB interest rates that have squeezed borrowing capacity across the continent. Yet, the domestic appetite for residential debt remains strong. Buyers are stretching their financial limits to escape a hyper-inflationary rental market, changing the dynamics of the state’s retail banking sector.
The Core Development
The scale of modern credit expansion becomes clear when looking at the hard metrics of domestic loan issuance. To understand the current trajectory of the first-time buyer mortgage Ireland landscape, one must analyze the raw volume of capital flowing from retail lenders to consumers. In the 12 months leading up to October 24, 2025, licensed credit institutions in Ireland approved a total of 30,503 individual loan applications specifically earmarked for new market entrants. This isn’t just a marginal year-on-year increase. It represents a structural shift that pushed total drawdown values within this single demographic segment to an aggregate of $8.2 billion.
Data compiled by the Central Bank of Ireland indicates that first-time buyers now account for over 60% of all residential mortgage activity by value, effectively crowding out buy-to-let investors and second-time movers. The average loan size for an individual purchaser in Dublin has climbed to $345,000, an all-time record that reflects the steady rise in urban property values.
+-------------------------------------------------------------+
|     IRISH RESIDENTIAL MORTGAGE MARKET SHARE (BY VALUE)      |
+-------------------------------+-----------------------------+
| Market Segment                | Percentage Share            |
+-------------------------------+-----------------------------+
| First-Time Buyers             | 61.5%                       |
| Second-Time / Mover Buyers    | 24.0%                       |
| Residential Buy-to-Let        |  3.5%                       |
| Re-mortgage / Top-up          | 11.0%                       |
+-------------------------------+-----------------------------+
This high level of activity is happening despite a significant reduction in the number of active banks in the country. Following the departure of Ulster Bank and KBC Bank from the domestic market, the remaining three retail institutions—Allied Irish Banks, Bank of Ireland, and Permanent TSB—now manage a highly concentrated lending market.
This corporate concentration has not dampened consumer demand. Instead, the intense competition for market share among these remaining lenders has led to targeted product offerings for buyers who qualify for state assistance. The state’s current economic position, characterized by low unemployment and strong corporate tax receipts from multinational technology hubs, continues to support high consumer demand.
Wages in the professional services, engineering, and technology sectors have risen by an annualized 5.4% over the past year. This wage growth provides a steady stream of qualified applicants who can meet strict institutional lending requirements. Consequently, mortgage approval rates Dublin and surrounding commuter counties like Meath, Kildare, and Wicklow have stayed resilient, even as wider European credit growth slows down.
What is Driving the Surge in Irish First-Time Buyer Mortgages?
Featured Snippet Target: The surge in the first-time buyer mortgage Ireland market is driven by severe rental cost inflation, strong wage growth in corporate sectors, and state interventions like the Help-to-Buy scheme and the First Home Scheme. These factors allow buyers to bypass traditional deposit shortfalls and secure properties despite rising prices.
Policy Intervention and Market Mechanics
The current state of Irish housing market trends cannot be evaluated without considering state programs that alter normal market forces. The current credit expansion is partly driven by two specific policy tools implemented by the Department of Housing: the Help-to-Buy tax rebate scheme and the First Home Scheme equity loan system. These interventions were designed to address the deposit gap for middle-income workers, but they have also supported higher price floors across new housing developments.
       [State Equity Support: First Home Scheme]
                         │
                         ▼
  [Developer Top-Up] ──► [First-Time Buyer] ◄── [Commercial Bank Loan]
                         ▲
                         │
         [Tax Rebate: Help-to-Buy Scheme]
The Help-to-Buy initiative allows buyers to claim back up to $33,000 in income tax paid over the preceding four years to use directly as a property deposit. Meanwhile, the First Home Scheme operates as a shared-equity system, where the state takes up to a 30% stake in a new-build property to bridge the gap between the buyer’s maximum bank loan and the total purchase price. On paper, these initiatives solve the immediate liquidity problem that keeps young professionals trapped in high-rent tenancies.
In practice, however, they provide state-backed capital that matches the Central Bank of Ireland lending rules, which currently cap traditional borrowing at 4.0 times an applicant’s gross annual income. For example, a couple earning a combined salary of $95,000 can borrow a maximum of $380,000 under current macroprudential limits. By layering the tax rebate and the equity loan on top of this base, their total purchasing capacity can clear $480,000.
This dynamic helps explain why prices for new-build homes have risen faster than prices for older, second-hand properties. It also shows that the current high level of lending is closely tied to ongoing government fiscal support.
Downstream Consequences and Second-Order Effects
This long-term accumulation of mortgage debt has significant implications for Ireland’s broader economic stability and demographic trends. As young buyers dedicate a large share of their disposable income to servicing long-term debt, their broader spending patterns are shifting. Economist Dr. Conor O’Toole, writing in an assessment for the Economic and Social Research Institute, noted that households with high debt-to-income ratios are more exposed to external economic shocks, such as global downturns that could impact the country’s multi-national export sector.
Still, the immediate concern is the growing gap within the domestic property landscape. Because state equity programs apply almost exclusively to brand-new houses, first-time buyers are concentrated in specific geographic corridors. This has caused localized price spikes in suburban developments outside Dublin, while older urban properties face different market conditions.
+-------------------------------------------------------------+
|          NEW VS. SECOND-HAND HOUSING PRICE TRAJECTORY       |
+-------------------------------+-----------------------------+
| Property Category             | Annual Price Acceleration   |
+-------------------------------+-----------------------------+
| New-Build Residential Units   | +9.2%                       |
| Second-Hand Urban Apartments  | +3.1%                       |
| Commuter Belt Family Homes    | +7.8%                       |
+-------------------------------+-----------------------------+
The corporate sector is also adjusting to these conditions. Large institutional investors, who previously bought entire apartment complexes to rent out, are scaling back their purchases due to higher global interest rates. This retreat has allowed individual purchasers using affordable housing schemes Ireland to buy units in developments that would have previously been sold to international funds.
What follows, however, is a clear squeeze on supply. Every house bought by a first-time buyer removes a unit from the available supply for a long period, which keeps rental availability near historic lows. The national property registry shows that the turnover rate for residential properties sits at just 2.3% of total housing stock annually, which is well below the European average of 4.5%.
Challenging the Momentum
Is this high level of mortgage activity sustainable, or does it signal growing risks in the market? Many market analysts point to the strict credit assessments required under current lending rules as proof that the market is safe from a 2008-style collapse. Today’s borrowers must undergo rigorous stress testing against potential interest rate increases, and banks maintain much higher capital reserves than they did two decades ago.
The picture is more complicated when we consider structural supply deficits. Some independent analysts argue that current credit volumes are artificially inflated by a lack of alternative options.
               [Structural Supply Gap Overview]

  45,000 ───────────────────────────────── Estimated Annual Demand

  32,000 ═════════════════════════════ actual 2025 Completions

  13,000 ───────────────────────────── Net Annual Deficit
With single-bedroom apartments in Dublin regularly renting for over $2,400 per month, purchasing a home with a monthly mortgage payment of $1,700 can look like a rational financial choice, even at peak property valuations. This means demand may be driven more by high rental costs than by long-term confidence in asset values.
If the country’s multinational employment sector faces a downturn, many households could find themselves exposed. A household that bought a property at the top of the market using maximum state equity support has a limited financial buffer if property values drop or household income falls.
A Complex Equilibrium
The current high level of first-time buyer activity reflects a unique combination of strong domestic employment, targeted state support, and a persistent imbalance between housing supply and demand. This trend is distinct from the speculative, credit-driven bubble of the mid-2000s. Today’s market is shaped by working professionals using structured state programs to secure housing in a high-cost environment.
The central challenge for policymakers is clear. Government programs have successfully helped thousands of buyers enter the property market, but they have also supported high prices in a supply-constrained environment. Until overall housing construction matches structural demand, these record lending volumes will likely reflect the high cost of entry rather than an easy path to homeownership.
The Irish property market remains a complex environment where access to credit is a vital, yet expensive, asset.

The phone calls from American buyers haven’t stopped. Neither have the shipments. For many Singapore-based companies with exposure to the United States, the Trump administration’s 10% baseline tariff — widely feared when it landed in April 2025 — has turned out to be, as more than one founder has privately put it, something they can live with. The margin hit is real. The commitment to the US market is, for now, intact.
This isn’t naivety. Singapore’s business class is too wired into global trade to mistake inconvenience for catastrophe. What the past twelve months have revealed, instead, is a calibrated judgement: that America’s consumer base, its legal predictability, and its sheer scale still make it the world’s most attractive destination, tariff or no tariff.
Why Singapore’s Export Sector Held Up Better Than Expected
When the White House announced its sweeping reciprocal tariffs on April 2, 2025 — quickly dubbed “Liberation Day” — Singapore found itself in an unusual position. The city-state was handed the lowest rate in Southeast Asia: a 10% baseline, compared with 19% to 40% for neighbours like Vietnam, Indonesia, and Cambodia. This was in spite of Singapore holding a free trade agreement with Washington that had been in force since January 2004 — and despite the US actually running a goods trade surplus with Singapore.
That anomaly still rankles in Singapore’s government corridors. According to the US Trade Representative, the US goods trade surplus with Singapore reached $3.6 billion in 2025, up from $1.9 billion in 2024 — a near-doubling that makes the tariff’s rationale increasingly hard to justify on balance-of-payments grounds. In March 2026, Singapore’s trade ministry went public with its dispute of American trade data, arguing the official US figures misrepresent the bilateral picture.
Yet even with the duty in place, Singapore’s companies did something that surprised economists who had modelled for a significant contraction: they adapted and, in many cases, pushed on. The Ministry of Trade and Industry upgraded Singapore’s 2025 GDP forecast to around 4% in November — well above the 1.5% to 2.5% initially pencilled in — citing stronger semiconductor exports driven by the AI boom and unexpected resilience among trading partners. Full-year growth came in at 4.8%.
The US remains Singapore’s second-largest export destination, absorbing roughly 11% of the Republic’s domestic exports in 2024. Companies have not abandoned that relationship. Many have leaned into it harder, viewing tariff disruption elsewhere in Asia as a relative advantage.
A Manageable Levy, But Not a Costless One
How are Singapore companies dealing with US tariffs? The short answer is: largely by absorbing part of the cost, passing some on, and restructuring faster than anyone expected.
A March 2025 survey by the American Chamber of Commerce in Singapore found that most respondents planned to pass tariff-related costs through to US customers, while simultaneously accelerating supply chain diversification. This dual-track response reflects a broader strategic logic: protect the American relationship in the near term while reducing single-market dependency over a longer horizon.
What that looks like on the ground varies by sector. Manufacturers in precision engineering — a bright spot identified by MTI in its August 2025 briefing — have continued ramping up capital investment in AI-related semiconductor production, insulated partly by the global demand surge from data centre buildouts. These firms aren’t debating whether to serve the US market. They’re debating how to remain irreplaceable within it.
The picture is more complicated for smaller companies working with thinner margins. Nomura analysts reported in September 2025 that Singapore exporters were absorbing more than 20% of US tariff costs directly — a real and sustained squeeze. Still, for a 10% levy applied to goods that clear US customs at high average selling prices, the maths often still work. A Singapore med-tech firm shipping precision instruments at $15,000 per unit absorbs a very different blow than, say, a Vietnamese garment exporter facing a 32% rate on $8 t-shirts.
The relevant comparison isn’t between tariff and no-tariff Singapore. It’s between Singapore at 10% and its regional competitors at 19% to 40%. On that basis, the commercial case for the US market hasn’t collapsed. It’s narrowed — which is why the companies still in the game are typically those with the product quality to justify the premium or the brand equity to pass costs through.
The Sectoral Flashpoints: Pharma and Chips
Singapore’s composure at the aggregate level masks genuine alarm in two sectors that define its high-value export identity: pharmaceuticals and semiconductors.
Singapore ships approximately S$4 billion (US$3.1 billion) worth of pharmaceutical products to the United States each year. These are mostly branded drugs — sophisticated, high-value formulations — which faced a threatened 100% tariff unless manufacturers established a physical US manufacturing presence. That threat, announced as part of Trump’s sectoral tariff push, is currently on hold pending negotiations and exemption applications. But it has not disappeared. Deputy Prime Minister and Trade Minister Gan Kim Yong acknowledged in September 2025 that negotiations with Washington over both pharma and semiconductors were ongoing, with an “arrangement to allow us to remain competitive in the US market” still the goal rather than the outcome.
Minister Gan Siow Huang confirmed in October 2025 that a significant number of Singapore-based pharmaceutical firms are pausing US expansion decisions pending tariff clarity — a rational hold on capital allocation, not a signal of retreat. The broader concern, articulated by Gan Kim Yong, is longer-range: that escalating tariffs globally could divert investment away from Singapore toward the United States, draining capital that might otherwise have flowed into the region.
In semiconductors, Singapore’s position is partially protected by the AI-driven global demand spike. The precision engineering cluster saw continued investment ramp-ups through 2025, with MTI noting the “sustained shift towards higher value-added” activity as a structural buffer. Yet Section 232 sectoral tariffs on chips — not yet imposed but actively discussed in Washington — remain a latent risk that keeps Singapore’s trade negotiators in near-permanent engagement with US counterparts.
The Case Against Optimism: What the Bears Are Right About
It would be a misreading of Singapore’s resilience to treat it as vindication of the tariff-and-carry-on school of thought. The firms that are pressing ahead in the US market are, almost uniformly, those with structural advantages that most companies don’t have: high average selling prices, proprietary technology, brand recognition, or an irreplaceable position within a US supply chain.
For smaller Singapore companies — the SMEs that account for roughly two-thirds of the city-state’s workforce — the calculus looks different. EnterpriseSG acknowledged in early 2026 that tariffs would “continue to be a looming concern for a long time,” with sectoral duties on semiconductors and pharmaceuticals a persistent threat and the risk of trade diversion from tariff-hit neighbours an additional drag.
What tariff rate does Singapore face from the United States?
Singapore faces a 10% baseline US tariff — the lowest in Southeast Asia — under the Trump administration’s reciprocal tariff framework, despite a free trade agreement in force since 2004 and a US goods trade surplus of $3.6 billion in 2025. A further increase to 15% under Section 122 was announced in February 2026.
Government support has materialised, but its scope has limits. The Business Adaptation Grant, launched in October 2025, offers up to S$100,000 per company with co-funding required — meaningful for a one-person fintech studio rethinking its US go-to-market, but insufficient to offset the structural cost pressures facing an electronics manufacturer running US$50 million in American revenue. SMEs receive a higher support quantum; the grant’s architects acknowledge it can’t reach every firm.
There is also a timing question. Singapore’s 2025 outperformance was partly a function of front-loading: companies rushed exports in the first half of the year ahead of anticipated tariff escalation, driving a 13% NODX rebound in June that flattered the headline numbers. Strip out front-loading, and the structural growth trajectory is more modest. MTI has already warned that 2026 growth — forecast in the 1% to 3% range — will feel meaningfully different from 2025’s AI-and-front-loading-driven surge.
What follows, however, is not necessarily contraction. It is normalisation under a genuinely higher-tariff world — a world Singapore’s companies are, by now, better equipped to navigate than they were fourteen months ago.
The Structural Bet: Singapore’s Long-Term US Positioning
Singapore’s most consequential strategic response to Trump’s tariff regime has not been lobbying Washington or diversifying away from the US. It’s been doubling down on what makes Singaporean goods hard to replace: quality, reliability, and an institutional environment that American buyers trust.
Prime Minister Lawrence Wong has been careful not to overstate the resolution of US-Singapore trade talks, noting as recently as late 2025 that negotiations were at “a very early stage” on pharmaceuticals. But the underlying posture of Singapore’s business community — captured in a UOB Business Outlook Study from May 2025 — is instructive: eight in ten Singapore companies planned overseas expansion within three years, with North America among the markets specifically flagged by consumer goods and industrial firms despite the tariff environment.
That appetite reflects something the macro data alone can’t show. Many Singapore companies with US exposure have been building American relationships for decades. They know their buyers personally. They’ve invested in US certifications, US-compatible regulatory frameworks, US distribution networks. Walking away from that at a 10% tariff rate would mean writing off infrastructure that cost more than 10% to build.
The more profound question is whether the next generation of Singapore companies — those deciding now where to build their first international footprint — will make the same American bet their predecessors did. The EnterpriseSG data on market diversification is notable: in 2025, the agency helped Singapore companies enter 76 new markets — the broadest footprint in five years. Angola. Fiji. Markets that would have been afterthoughts in 2019.
The US isn’t losing its primacy in Singapore’s commercial imagination. But it is, for the first time in a generation, being weighed against alternatives in a way that feels genuinely open. That shift is subtle. It may also be durable.
There is a version of this story where 10% is, in fact, nothing — where Singapore’s companies absorb a manageable cost, keep their American relationships intact, and emerge from the tariff era with their US market share preserved or even expanded as higher-levied competitors retreat. That version is not impossible. Several major firms are living it.
But the more honest reading of the past twelve months is that Singapore’s business community has proved something more modest and more instructive: not that tariffs don’t matter, but that they don’t automatically determine outcomes. What matters, still, is whether you have something the American market genuinely wants. For companies that do, the levy is a tax on success. For those that don’t, it’s an exit ramp. The US market is sorting Singapore’s exporters, quietly and efficiently, in exactly the way markets always have.

2026 Economic Outlook: Investment Tips for Pakistani Investors

Anduril’s $6.6 Billion Submarine Shipyard Plan Explained

Life Insurance Comparison: Term vs. Whole Life and What Each Actually Costs

Stock Market Today: Nasdaq Hits Record High as Dow and S&P 500 Stumble on Middle East Diplomatic Shifts

Energy Market Spikes vs. Consumer App Data: What GasBuddy and Crude Prices Signal for Inflation

China’s FTAAP Push for APEC 2026 in Shenzhen: US Tariffs and Unite Asia-Pacific

AI Stocks Slide After Industry Leaders Call for a Development Slowdown

Singapore Stocks vs. Japan Stocks: Safe Havens in the Asian Economic Slowdown

Agentic AI in Finance: How Artificial Intelligence Is Replacing Routine Tasks on Wall Street

Fiscal Deficit and Public Debt

T-Mobile’s Enterprise Push and the Evolution of Modern Corporate Mobility Solutions

Enterprise Generative AI ROI 2026: The Adoption-to-Impact Gap Explained

Climate Finance and the Economic Reality of Passing 1.5°C

Business Insurance for Digital Exports: Protecting Your Company in the AI Era

Real Estate Crash Predictions 2026: Data-Backed Regional Guide
Unrecoverable Delays: How the St. Louis Strike Crippled Boeing’s F-15EX Eagle II

What is a “Lead-Left” Bank? Unpacking Morgan Stanley’s Role in Anthropic’s Mega-IPO

How to Invest in the Anthropic IPO: Step-by-Step Guide for Retail Investors

Mario Kart 8 Deluxe 4.0.0 Patch Notes: 8-Player Split Screen & CameraPlay

Is SPY Overvalued in September 2026? Fed Rate Hike Odds & Intrinsic Value

Top 15 Stocks for Investment in 2026 in PSX: Your Complete Guide to Pakistan’s Best Investment Opportunities

Debunking IMF Program Myths: Reconfiguring Engagement for True National Ownership in a Volatile World
China Economy 2026: Property Crisis, AI Investment & Export Surplus Explained

Top 10 Mutual Fund Managers in Pakistan for Investment in 2026: A Comprehensive Guide for Optimal Returns
China’s 50% Domestic Equipment Rule: The Semiconductor Mandate Reshaping Global Tech

What the U.S. Attack on Venezuela Could Mean for Oil and Canadian Crude Exports: The Economic Impact

15 Most Lucrative Sectors for Investment in Pakistan: A 2025 Data-Driven Analysis

Pakistan’s Export Goldmine: 10 Game-Changing Markets Where Pakistani Businesses Are Winning Big in 2025

Pakistan’s Stock Market Renaissance: How 2025’s Hottest Investment Opportunity Is Democratizing Wealth—A Complete Beginner’s Guide
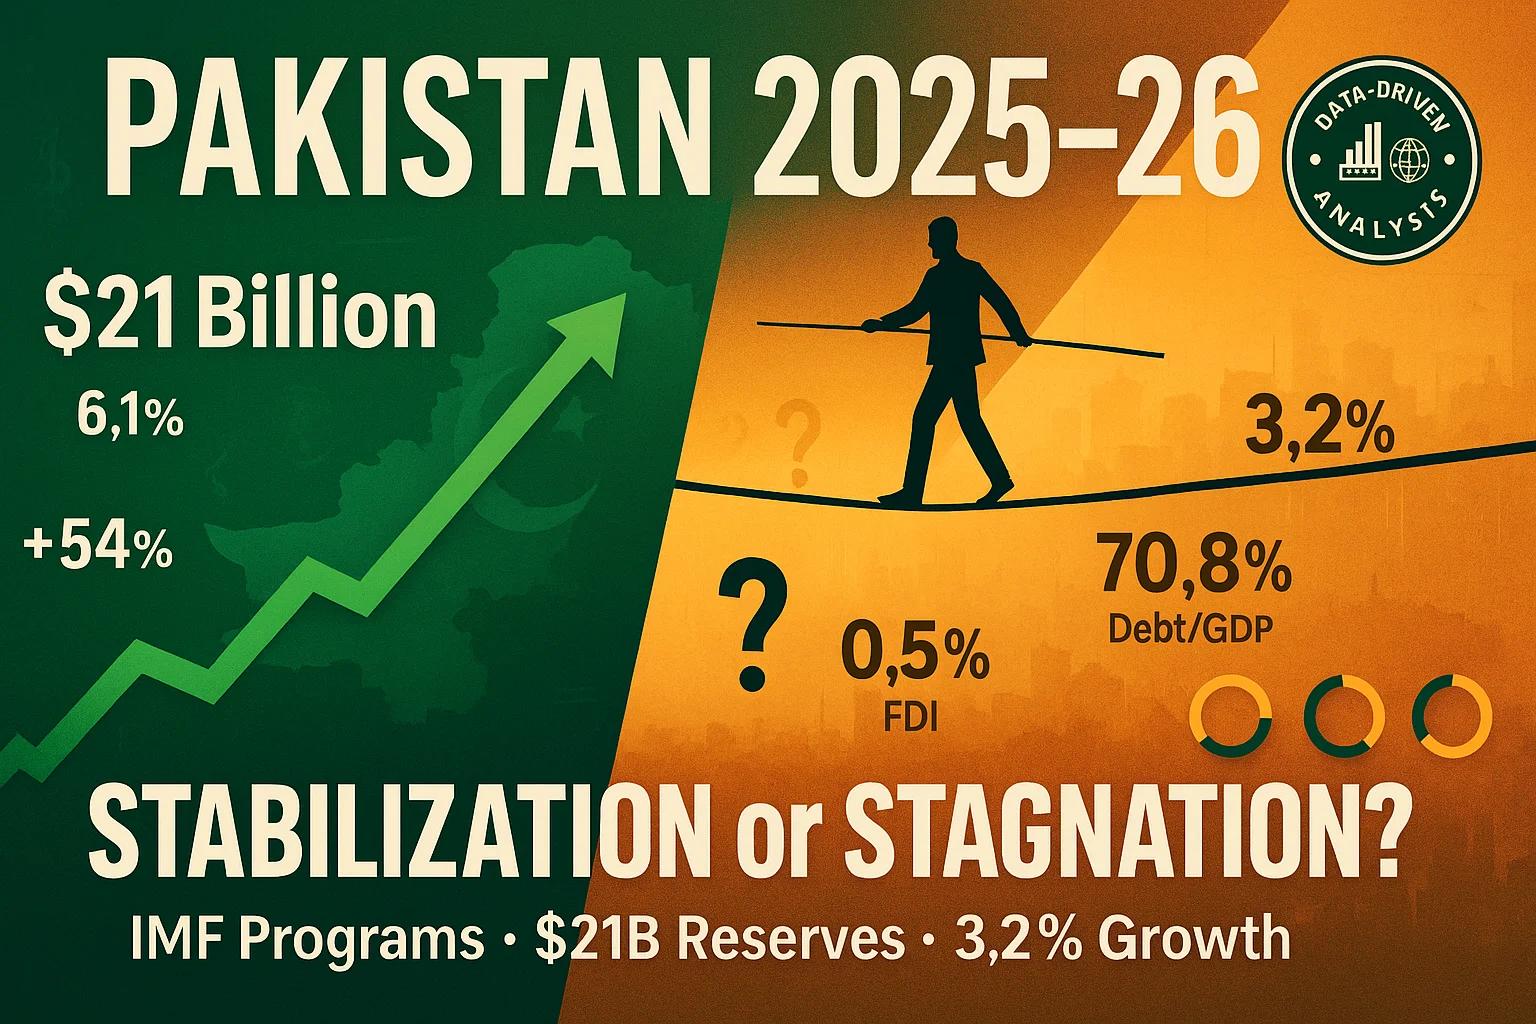
Pakistan’s Economic Outlook 2025: Between Stabilization and the Shadow of Stagnation
China’s Property Woes Could Last Until 2030—Despite Beijing’s Best Censorship Efforts

The Institutional Era: A Comprehensive Cryptocurrency Investment Analysis for 2026
Real Estate Crash Predictions 2026: Data-Backed Regional Guide

Best Investments in Pakistan 2026: Top 10 Low-Price Shares and Long-Term Picks for the PSX
DBS Hits S$1 Billion AI Value Milestone — But Agentic AI Poses Talent Challenges for Singapore Banks

The Contours of 21st-Century Geopolitics Will Become Clearer in 2026: A New World Is Starting to Emerge

How to Become an Active Taxpayer on Pakistan’s FBR Active Taxpayer List (ATL) in 2026: A Step-by-Step Guide

🌍 Davos 2026: The World Economic Forum Annual Meeting Sets the Stage for Global Transformation
Agentic AI in Finance: How Artificial Intelligence Is Replacing Routine Tasks on Wall Street

The New Executive Gold Standard: Top 10 Companies Lavishing Unprecedented Perks on CEOs and CFOs in 2025–2026
-
Markets & Finance10 months ago
Top 15 Stocks for Investment in 2026 in PSX: Your Complete Guide to Pakistan’s Best Investment Opportunities
-
Analysis9 months ago
Debunking IMF Program Myths: Reconfiguring Engagement for True National Ownership in a Volatile World
-
Analysis4 months ago
China Economy 2026: Property Crisis, AI Investment & Export Surplus Explained
-
Investment10 months ago
Top 10 Mutual Fund Managers in Pakistan for Investment in 2026: A Comprehensive Guide for Optimal Returns
-
Asia10 months ago
China’s 50% Domestic Equipment Rule: The Semiconductor Mandate Reshaping Global Tech
-
Global Economy10 months ago
What the U.S. Attack on Venezuela Could Mean for Oil and Canadian Crude Exports: The Economic Impact
-
AI10 months ago
15 Most Lucrative Sectors for Investment in Pakistan: A 2025 Data-Driven Analysis
-
Exports10 months ago
Pakistan’s Export Goldmine: 10 Game-Changing Markets Where Pakistani Businesses Are Winning Big in 2025