
Economy & Markets
Real Estate Crash Predictions 2026: Data-Backed Regional Guide


Every housing cycle produces a chorus of crash predictions, and 2026 has been no exception. But the data emerging through the third quarter tells a more measured story than the headlines suggest: this is a market undergoing what several major forecasters are now calling “The Great Recalibration” — not a collapse, but a prolonged, uneven reset in which affordability improves slowly, regionally, and unevenly rather than through a sharp price correction.
Key Takeaways
- No major forecaster — Fannie Mae, NAR, Zillow, Redfin, or Realtor.com — is projecting a national home price crash in 2026; forecasts cluster in a 1% to 4% annual price growth range.
- Existing home sales fell 4.2% in the first half of 2026, with June sales down 2.4% to a seasonally adjusted annual rate of 4.09 million units, according to the National Association of Realtors — softness driven by elevated mortgage rates, not distressed selling.
- 30-year fixed mortgage rates are expected to average roughly 6.3% through 2026, per consensus forecasts from Realtor.com, Redfin, and industry surveys — a “new equilibrium” rather than a return to sub-5% pandemic-era rates.
- Home values fell in 24 of the 50 largest US markets as of late 2025; Zillow projects that number to roughly halve to around 12 markets in 2026, indicating regional divergence rather than a uniform correction.
- Nearly two-thirds of prospective buyers (62%) have been waiting for rates to fall before purchasing — the same share that made the identical bet in 2025 and were wrong, underscoring the risk of timing the market on rate predictions alone.
The State of the 2026 Housing Market: Reset, Not Crash
The consensus among major housing economists — at Redfin, Zillow, NAR, Fannie Mae, and J.P. Morgan Global Research — is unusually aligned for a sector prone to disagreement: 2026 is a “recalibration” year, characterized by softening sales volume, modest price growth, and mortgage rates settling into a new, higher-than-pandemic-era range rather than a sharp downward price correction.
J.P. Morgan Global Research’s mid-2026 housing outlook noted that existing home sales pulled back 2.4% in June to a seasonally adjusted annual rate of 4.09 million units, extending a first-half 2026 decline of 4.2%. The bank attributed the softness directly to elevated mortgage rates rather than to distressed inventory or forced selling — a critical distinction from the dynamics that preceded the 2008 crash, where oversupply and subprime defaults, not rate-driven demand softness, drove the collapse.
Mortgage Rate Trajectory: The Central Variable
Mortgage rates remain the single most important variable shaping the 2026 housing market. Forecasts have converged around an average 30-year fixed rate near 6.3% for the year, with Fannie Mae’s Home Price Expectations Survey — which polls more than 100 housing economists — projecting home prices to rise a modest 1.7% in 2026 and 2% in 2027 under that rate assumption. Some forecasters see slightly more optimistic paths: S&P Global has projected an average closer to 5.77%, while Zillow has taken the more cautious position that rates will likely stay above 6% throughout 2026 despite gradual easing.
| Forecaster | 2026 Home Price Growth | 2026 Mortgage Rate (30-yr avg) |
|---|---|---|
| Fannie Mae | +3.2% | ~6.3% |
| National Association of Realtors | +4.0% (median price) | ~6.3% |
| Mortgage Bankers Association | +0.6% | ~6.3% |
| Realtor.com | +2.2% | ~6.3% |
| Zillow | +1.2% | Above 6% |
| Redfin | +1.0% | Low 6% range |
No forecaster in this table projects a price decline — the dispersion is between “modest growth” and “very modest growth,” which is the clearest quantitative rebuttal to crash narratives currently circulating in social media and lower-authority financial commentary.
Regional Divergence: Where the Real Risk Sits
The national picture obscures significant regional variation, and this is where “crash predictions” have the most factual grounding — at the metro level, not the national level. Zillow’s research noted that home values fell in 24 of the 50 largest US markets as of October 2025, with that number of declining markets expected to roughly halve to about 12 in 2026 as affordability improves. This implies that roughly a quarter of major US metros experienced genuine, if modest, price depreciation heading into 2026 — a regional reality that gets flattened into “national crash” narratives online but is more accurately described as localized correction concentrated in previously overheated Sun Belt and pandemic-boomtown markets.
Inventory: The Structural Wildcard
Inventory levels are projected to increase by approximately 8.9% to 12% in 2026, according to appraisal-industry forecasting, though they remain below pre-pandemic averages. This matters directly for crash risk: a genuine price collapse typically requires oversupply relative to demand. Current inventory growth, even at the high end of forecasts, is not projected to push supply into the oversupplied territory that preceded the 2008 downturn — it is a gradual normalization from historically tight conditions, not a supply glut.
The “Waiting for Rates to Fall” Trap
One of the more revealing data points for 2026 buyer psychology comes from a U.S. News survey: nearly two-thirds of prospective homebuyers (62%) were waiting for mortgage rates to fall before buying in 2026 — and the identical share (62%) made the same bet in 2025, and lost it, as rates did not fall meaningfully. This is a behavioral pattern directly analogous to the cash-hoarding trap in personal savings: postponing action based on a rate prediction that forecasters themselves have repeatedly gotten wrong carries its own opportunity cost, particularly if home prices continue their modest upward drift as most forecasters project.
Mortgage Rate Strategies for 2026 Buyers and Owners
- Rate locks with float-down options. With rates expected to hover in a narrow 6.0%–6.5% band rather than swing dramatically, a float-down provision on a rate lock offers modest downside protection without requiring buyers to time a broader market move.
- Adjustable-rate mortgages for shorter holding periods. For buyers expecting to sell or refinance within 5–7 years, ARMs priced meaningfully below the 6.3% fixed-rate consensus can reduce carrying costs without exposure to a 30-year rate commitment.
- Points purchases in a stable-rate environment. Because forecasters see rates stabilizing rather than falling sharply, buying down the rate with points becomes more mathematically attractive than in a falling-rate environment where a near-term refinance might otherwise recapture the cost.
- Regional due diligence over national headlines. Given that roughly a quarter of major metros were still seeing price declines heading into 2026, buyers and investors should underwrite specific metro-level inventory and price-trend data rather than relying on national crash or boom narratives.
Frequently Asked Questions
Is the US housing market going to crash in 2026?
No major housing forecaster — including Fannie Mae, NAR, Zillow, Redfin, and the Mortgage Bankers Association — projects a national price decline in 2026; forecasts range from roughly 0.6% to 4% price growth, with existing home sales projected to be flat to modestly higher.
Why do home sales keep falling if prices aren’t crashing?
Existing home sales fell 4.2% in the first half of 2026 primarily because elevated mortgage rates (averaging around 6.3%) are suppressing transaction volume, not because of distressed or forced selling — a key structural difference from the 2008 crash.
Should I wait for mortgage rates to drop before buying?
Roughly 62% of buyers made this bet in both 2025 and 2026, and rates did not fall meaningfully either year according to consensus forecasts; buyers evaluating this strategy should weigh the opportunity cost of continued modest home-price appreciation against uncertain rate movement.
Conclusion
The 2026 real estate data supports a “Great Recalibration” thesis, not a crash thesis: sales volume is softening under the weight of a stabilized-but-elevated 6.3% mortgage rate environment, national price growth remains positive across every major forecaster, and the genuine downside risk is concentrated regionally in a shrinking subset of previously overheated metros rather than distributed nationally. For buyers, sellers, and investors, the 2026 opportunity lies less in timing a crash that the data does not support and more in navigating rate strategy and regional selection with precision.






Economy & Markets
Stock Market Today: Nasdaq Hits Record High as Dow and S&P 500 Stumble on Middle East Diplomatic Shifts


While the broader market struggled to find a definitive direction on September 23, 2026, the tech-heavy Nasdaq Composite secured another record close. Investors continue to exhibit a voracious appetite for artificial intelligence (AI) and semiconductor stocks, viewing them as long-term structural winners despite underlying macroeconomic crosscurrents.
Meanwhile, the Dow Jones Industrial Average and the S&P 500 failed to catch the tech sector’s tailwind, pressured by sliding oil prices and a rotation out of traditional blue-chip sectors.
Key Market Takeaways
- Nasdaq Extends AI-Fueled Rally: The index surged to a fresh record closing high, fueled by continued momentum in high-performance chipmakers and mega-cap tech stocks.
- Dow Jones & S&P 500 Lag: The Dow shed over 185 points, while the S&P 500 ended flat as investors rotated out of industrial and energy names.
- Oil Prices Slip Below $100: Global crude benchmarks pulled back sharply following productive U.S.-Iran diplomatic discussions at the United Nations.
- Bond Yields Stabilize: The 10-year Treasury yield cooled slightly, slipping back under the critical 5% threshold, offering relief to rate-sensitive equities.
Major Index Performance (September 23, 2026)
| Index | Closing Price | Point Change | Percentage Change |
| Nasdaq Composite | 27,244.28 | +121.15 | +0.45% |
| S&P 500 | 7,764.27 | -0.43 | -0.01% |
| Dow Jones Industrial Average | 51,863.69 | -185.14 | -0.36% |
Tech Leads the Charge While the Dow Drifts
The divergence between high-growth technology and cyclical sectors was the defining narrative of the session. According to market data analyzed by Zacks Investment Research, the Information Technology Select Sector SPDR (XLK) rose 0.7%, masking broader weaknesses in the market.
Semiconductor companies carried the bulk of the index’s weight. High-performance power chipmaker Monolithic Power Systems (MPWR) jumped over 8%, while industry stalwarts like Micron, Nvidia, and Advanced Micro Devices (AMD) all contributed to the upward momentum.
Conversely, the Dow Jones Industrial Average dropped 0.36%, weighed down by lagging industrial stocks and banking financials like JPMorgan Chase and Wells Fargo. The S&P 500 finished effectively flat, reflecting an aggressive tug-of-war between soaring tech valuations and struggling traditional sectors.
Crude Oil Slides Amidst U.S.-Iran Diplomatic Progress
Energy markets commanded outsized attention as both Brent and West Texas Intermediate (WTI) crude experienced notable declines. Brent crude slipped back below the psychological $100-per-barrel mark, settling near $98.68, while WTI fell toward $89.64.
The primary catalyst for the selloff was a geopolitical de-escalation signal. As reported by BNN Bloomberg, diplomatic progress during “very good” meetings between U.S. and Iranian officials at the UN General Assembly helped soothe global energy supply anxieties. This geopolitical cooling temporarily offset supply-side fears stemming from a recent armed blockade at Libya’s El Sharara oil field.
Treasury Yields Cool, Easing Pressure on Equities
Bond markets provided a much-needed tailwind for growth stocks, acting as a counterbalance to the broader economic uncertainty. The benchmark 10-year U.S. Treasury yield touched an intraday high of 4.98% on hawkish Federal Reserve commentary before retreating back to hover near 4.94% by the close.
Falling oil prices naturally provide relief from the inflation and interest rate concerns that have dominated September trading, as highlighted by TheStreet. Stable borrowing costs help keep mortgage rates and corporate debt manageable, granting investors the confidence to bid up valuations in long-duration tech assets.
What to Watch Next
As Wall Street digests Wednesday’s split-market action, institutional focus is pivoting toward critical upcoming macroeconomic and corporate events:
- U.S.-China Summit: A highly anticipated meeting in Washington, D.C., later this week could yield progress on a trade truce and potentially spark new bilateral frameworks for global AI regulation.
- Corporate Earnings: Paychex (PAYX) and Cintas (CTAS) will provide fresh insights into small-business payroll trends and broad corporate hiring, giving investors a real-time read on the health of the U.S. labor market. Retail bellwether Costco Wholesale (COST) is also slated to report on Thursday, which will serve as a barometer for big-ticket consumer demand.
Economy & Markets
Energy Market Spikes vs. Consumer App Data: What GasBuddy and Crude Prices Signal for Inflation

Gasoline rose 3.9% in August and drove over a third of the CPI increase. Inside the crude-to-pump-to-CPI chain and what it means for the next Fed decision.There is a clean, traceable chain running from a Saudi pipeline to a Bureau of Labor Statistics table, and August 2026 is the cleanest illustration of it in years.
Executive Summary / Key Takeaways
- The August 2026 CPI, released 11 September, showed the all-items index up 0.4% on the month and 3.4% over twelve months.
- The gasoline index rose 3.9% in August, accounting for over one third of the entire monthly all-items increase. Energy overall rose 2.1% after falling 1.5% in July.
- Year-on-year, gasoline was up 27.4% and fuel oil up 52%, while energy as a whole rose 16.3%.
- Core CPI, excluding food and energy, rose 0.3% on the month but slowed to 2.4% annually — the lowest reading since March 2021.
- The divergence is the signal: headline inflation is being generated almost entirely by energy while underlying price pressure cools. That is the precise configuration that makes a supply-shock tightening cycle contentious.
The Consumer Price Index rose 0.4% month-on-month in August, meeting consensus, and held at 3.4% on a twelve-month basis, per TD Economics. Energy costs rose 2.1% monthly, led by a 3.9% gain in gasoline. Food rose a subdued 0.1% for a second consecutive month and is up 2.7% over the year. Excluding food and energy, core prices rose 0.3% monthly — a tick hotter than expectations — while the twelve-month core rate edged down to 2.4%, with the three-month annualised at a softer 2.0%.
The BLS itself flagged the concentration: the gasoline index accounted for over one third of the monthly all-items increase.
2. Core Analysis: The Transmission Chain
2.1 August CPI in detail
| Component | Monthly change | Annual change | Note |
|---|---|---|---|
| All items | +0.4% | +3.4% | Strongest monthly rise in three months |
| Core (ex food & energy) | +0.3% | +2.4% | Lowest annual reading since March 2021 |
| Gasoline | +3.9% | +27.4% | Over one-third of the monthly headline increase |
| Energy (all) | +2.1% | +16.3% | After -1.5% in July |
| Fuel oil | +10.1% | +52.0% | Sharpest annual move in the report |
| Electricity | -0.2% | +3.8% | Declined monthly |
| Natural gas | -1.1% | — | Declined monthly |
| Shelter | +0.3% | +3.0% | Eased from 3.2% |
| Food | +0.1% | +2.7% | Eased from 3.0% |
| Airline fares | +2.7% | — | Fuel pass-through visible |
Data compiled from the BLS release, Trading Economics and Fox Business reporting.
2.2 Crude to pump to CPI
The chain has three links and a measurable lag at each.
Crude to pump. Crude is the largest single cost in a gallon of gasoline, and pump prices generally track WTI and Brent with a one-to-two week lag. WTI has traded near $103 and Brent near $107, following Houthi attacks that shut a crucial Saudi crude pipeline bypassing the Strait of Hormuz.
Pump to CPI. The BLS surveys consumer prices up to the previous month, so the August report published on 11 September reflects August pump prices — which averaged well below the $4.329 recorded on 15 September, per AAA data. Real-time retail fuel readings therefore lead the gasoline index by roughly four to six weeks.
CPI to policy. The August report showed inflation remaining elevated on rising energy prices, which Vanguard senior economist Josh Hirt said made a September rate hike more likely, per Fox Business. The Fed hiked on 16 September.
That is the full loop, and it took roughly six weeks from pipeline to policy decision.
2.3 Why headline and core diverged
Core inflation falling to 2.4% — its lowest since March 2021 — while headline holds at 3.4% is the most consequential detail in the release, and most coverage buried it.
Core below headline means energy is the primary driver and underlying price pressures are cooling. Shelter, the largest single CPI component, rose a comparatively modest 0.3% monthly and 3.0% annually, elevated historically but not accelerating the way energy is, per analysis of the release. Used vehicle prices are essentially flat year-on-year at +0.4% and new vehicles up only 0.6%, meaning that outside gasoline, transportation is not an inflation driver at all.
Headline is also well off its peak. The 3.4% annual rate is down from the April 2026 peak of 4.2%.
3. Structural Drivers and Competitor Gaps
Retail fuel telemetry as a leading indicator. Because CPI surveys lag by a month and publishes with a further delay, real-time pump-price data is genuinely predictive of the gasoline index — the single most volatile and most headline-relevant CPI component. With national averages running above $4.30 in mid-September against August levels, the September CPI due 14 October carries upside risk on the energy line before any other factor is considered.
The second-round question. Because energy costs feed into shipping, manufacturing and agriculture, economists watch a spike like this for early signs it will appear in core figures in following months. August’s evidence is mixed: core services rose 0.3% monthly on a sharp acceleration in non-housing services (+0.6%), which is where energy pass-through would first appear, even as annual core fell. Airline fares up 2.7% monthly is the cleanest visible pass-through in the report.
The policy disagreement this creates. Treasury Secretary Scott Bessent argued that the Fed typically does not raise rates during a supply shock until second- or third-order inflationary effects appear. The August data is genuinely ambiguous on whether those effects have arrived — annual core at a five-year low argues no; non-housing services acceleration argues possibly. Both sides of the September policy debate could cite this release honestly.
What households actually experience. Gasoline and fuel oil increases hit budgets immediately and visibly at every fill-up, rather than in a monthly bill. A 27.4% annual gasoline increase compounding already-elevated shelter costs means many households are absorbing higher costs on two of their largest monthly expenses at once — which is why consumer inflation expectations track headline rather than core, and why the Fed cannot simply look through energy.
Where the forecasts failed. GasBuddy’s pre-conflict outlook projected a 2026 national average of $2.97 a gallon. The actual reading is $4.329. Any inflation model built in late 2025 embedded an energy assumption that missed by roughly $1.35 a gallon, which is most of the gap between forecast and realised headline CPI this year.
4. Key Implications for Stakeholders
Economists and forecasters. Model headline and core separately and weight retail fuel telemetry into the near-term headline path. The September CPI on 14 October is the key test of whether August’s gasoline spike is sustained or reversed.
Inflation trackers. The 3.4% headline is not a signal of broad-based inflation. Strip energy and the picture is a 2.4% core running at a 2.0% three-month annualised pace — close to target. The economy has an energy problem, not a generalised inflation problem.
Retail traders. Watch Saudi East-West pipeline restoration. The kingdom indicated it could restore around half of capacity within days and full operations within six weeks. A confirmed restoration would remove the dominant CPI driver within one to two print cycles.
Households and budgeters. The gap between headline and core explains why official inflation feels understated: energy and shelter, the two most visible household costs, are both running above the core rate.
5. Frequently Asked Questions
Q1: What was the August 2026 inflation rate?
The CPI rose 0.4% month-on-month and 3.4% over twelve months, unchanged from July and down from the April 2026 peak of 4.2%. Core CPI rose 0.3% monthly and 2.4% annually.
Q2: How much did gasoline contribute to inflation?
The gasoline index rose 3.9% in August, accounting for over one third of the entire monthly all-items increase, and is up 27.4% year-on-year. Energy overall rose 2.1% monthly and 16.3% annually.
Q3: Why is core inflation lower than headline inflation?
Because energy is driving the headline figure while underlying pressures cool. Core CPI, which excludes food and energy, fell to 2.4% annually — the lowest since March 2021 — with shelter easing to 3.0% and vehicle prices essentially flat.
Q4: When is the next CPI report?
The September 2026 CPI is scheduled for release on Wednesday, 14 October 2026 at 8:30 a.m. ET. It will show whether the August gasoline spike was sustained.

Key Takeaways
- Singapore’s STI is being driven higher by its three local banks, whose growing wealth-management fee income — unburdened by capital-buffer requirements — is fueling rising dividend payout ratios.
- Japan’s Nikkei 225 has been far more volatile in September 2026, swinging from an intraday high near 66,400 to a 1.93% drop to 64,011 in the same week, as oil-driven bond-yield spikes hit AI-linked names like SoftBank and Advantest hardest.
- Singapore’s MAS has committed a combined S$8 billion across its Equity Market Development Programme, Anchor Fund, and Financial Sector Development Fund to deepen SGX liquidity and attract listings.
- Japanese equities’ “safe haven” reputation looks fragile in the current environment, per Capital Economics, because Bank of Japan rate-hike expectations are now colliding with imported inflation from elevated oil prices.
- For income-focused investors, Singapore’s REITs and bank stocks currently offer more stable, less rate-sensitive yield than Japan’s tech-heavy, more volatility-prone index.
As the global economy absorbs the twin shocks of a prolonged US-Iran war and an AI-driven technology boom, investors have been asking which Asian market deserves the “safe haven” label this cycle: Singapore or Japan. The honest answer, based on September 2026 trading, is that they’re behaving very differently — and dividend-seeking investors should understand why before allocating capital to either.
Singapore: Bank-Led Stability
Singapore’s benchmark Straits Times Index (STI) has been underpinned largely by its financial sector. The three local banks — DBS, OCBC, and UOB — have benefited from Singapore’s status as a regional wealth-management hub, with assets under management climbing as global capital seeks stability amid geopolitical tensions elsewhere. Crucially, fee income from wealth management isn’t subject to the same regulatory capital buffers as traditional lending, letting banks convert that income more efficiently into rising dividends per share.
Singapore’s regulators have also been proactively deepening the market. The Monetary Authority of Singapore (MAS) has layered a S$1.5 billion addition to its Financial Sector Development Fund on top of the existing S$5 billion Equity Market Development Programme launched in 2025, plus a further S$1.5 billion committed to an Anchor Fund aimed at attracting quality IPOs to the Singapore Exchange (SGX) — a combined push of roughly S$8 billion to boost liquidity and listings.
Singapore REITs: Yield With Nuance
Singapore-listed REITs (S-REITs) remain a core income vehicle, with the market-cap-weighted iEdge S-REIT index yielding roughly 6.3%, rising to 6.8–7.0% on an equal-weighted basis. But yield alone doesn’t tell the full story. Sasseur REIT, for example, delivered 10.2% DPU growth in the first half of 2026 on the back of strong Chinese outlet-mall sales — but that same exposure to Chinese consumption cuts both ways given China’s uneven recovery. Meanwhile, Mapletree Pan Asia Commercial Trust has seen its DPU pressured by weakening Japan occupancy (down to 56% from 75.1%) and negative rental reversion in China, even as Singapore itself now contributes 61% of its asset base. The lesson: not every “Singapore” dividend stock is a pure Singapore bet.
Japan: Higher Beta, Higher Risk
Japan’s Nikkei 225 tells a much choppier story. Earlier in September, the index surged over 2% in a single session to 66,399.84, riding broad tech-stock gains alongside South Korea’s Kospi. But within the same week, the picture flipped: the Nikkei 225 dropped 1.93% to 64,011, with the broader Topix slipping 0.65%, as elevated oil prices and rising global bond yields hit sentiment hard. AI and tech-linked names bore the brunt — Kioxia Holdings fell as much as 8.6%, SoftBank Group dropped up to 12%, and Advantest and Tokyo Electron both posted multi-percent declines.
The proximate trigger was Saudi Arabia shutting down its East-West pipeline — a key Hormuz-bypass route — which pushed oil prices higher and strengthened expectations that both the US Federal Reserve and the Bank of Japan would raise interest rates. That combination — imported energy inflation plus tighter domestic monetary policy — is precisely the scenario that undermines Japan’s traditional “safe haven” framing. As Capital Economics’ Marcel Theliant has noted, Japan’s safe-haven appeal currently looks fragile, with GDP growth momentum expected to cool as investment eases and exports soften.
Head-to-Head Comparison
| Metric | Singapore (STI / S-REITs) | Japan (Nikkei 225) |
|---|---|---|
| September 2026 volatility | Relatively stable, bank-led | High — swung from +2.1% to -1.9% within days |
| Key driver | Wealth-management fee income, MAS liquidity programs | AI/tech-stock sentiment, BOJ rate-hike expectations |
| Yield profile | ~3.5–6% (banks), 6.3–7% (S-REITs) | Lower dividend yields; more capital-appreciation focused |
| Rate sensitivity | Lower — banks benefit from higher rates | Higher — tightening BOJ policy pressures tech valuations |
| 2026 headline risk | China/Japan exposure within specific REITs | Oil-driven bond yields, Hormuz disruption spillover |
Why This Matters for Asian Equity Allocation
For investors explicitly seeking a defensive, income-generating position within Asia during the current global economy slowdown, the September 2026 data suggests Singapore’s bank- and REIT-led market has behaved more like a genuine safe haven than Japan’s tech-heavy index, which remains highly correlated to global risk sentiment and energy-driven rate expectations. That doesn’t make Japan uninvestable — some strategists still see the Nikkei trading toward 55,000–60,000 by year-end on reasonable valuations and BOJ-tightening-adjusted earnings growth — but it does mean Japan currently functions more as a leveraged growth play on the AI cycle than as ballast against volatility elsewhere in a portfolio.
Frequently Asked Questions
Is Singapore or Japan a better safe-haven stock market right now?
Based on September 2026 trading behavior, Singapore’s bank- and REIT-led market has shown more stability, while Japan’s Nikkei 225 has swung sharply due to its heavier weighting toward oil-sensitive, rate-sensitive tech names like SoftBank and Advantest.
Why are Singapore REITs attractive for dividend investors?
S-REITs currently yield roughly 6.3% on a market-cap-weighted basis and up to 7% equal-weighted, and Singapore dividends aren’t taxed at the individual level — though investors should check each REIT’s specific overseas exposure, as some carry meaningful Japan or China revenue concentration.
Why did Japanese tech stocks fall sharply in September 2026?
A Saudi pipeline shutdown pushed oil prices higher, strengthening expectations that both the Federal Reserve and the Bank of Japan would raise interest rates — a combination that hit AI and semiconductor-linked Japanese stocks particularly hard.

2026 Economic Outlook: Investment Tips for Pakistani Investors

Anduril’s $6.6 Billion Submarine Shipyard Plan Explained

Life Insurance Comparison: Term vs. Whole Life and What Each Actually Costs

Stock Market Today: Nasdaq Hits Record High as Dow and S&P 500 Stumble on Middle East Diplomatic Shifts

Energy Market Spikes vs. Consumer App Data: What GasBuddy and Crude Prices Signal for Inflation

China’s FTAAP Push for APEC 2026 in Shenzhen: US Tariffs and Unite Asia-Pacific

AI Stocks Slide After Industry Leaders Call for a Development Slowdown

Singapore Stocks vs. Japan Stocks: Safe Havens in the Asian Economic Slowdown

Agentic AI in Finance: How Artificial Intelligence Is Replacing Routine Tasks on Wall Street

Fiscal Deficit and Public Debt

T-Mobile’s Enterprise Push and the Evolution of Modern Corporate Mobility Solutions

Enterprise Generative AI ROI 2026: The Adoption-to-Impact Gap Explained

Climate Finance and the Economic Reality of Passing 1.5°C

Business Insurance for Digital Exports: Protecting Your Company in the AI Era
Real Estate Crash Predictions 2026: Data-Backed Regional Guide

Unrecoverable Delays: How the St. Louis Strike Crippled Boeing’s F-15EX Eagle II

What is a “Lead-Left” Bank? Unpacking Morgan Stanley’s Role in Anthropic’s Mega-IPO

How to Invest in the Anthropic IPO: Step-by-Step Guide for Retail Investors

Mario Kart 8 Deluxe 4.0.0 Patch Notes: 8-Player Split Screen & CameraPlay

Is SPY Overvalued in September 2026? Fed Rate Hike Odds & Intrinsic Value

Top 15 Stocks for Investment in 2026 in PSX: Your Complete Guide to Pakistan’s Best Investment Opportunities

Debunking IMF Program Myths: Reconfiguring Engagement for True National Ownership in a Volatile World

China Economy 2026: Property Crisis, AI Investment & Export Surplus Explained

Top 10 Mutual Fund Managers in Pakistan for Investment in 2026: A Comprehensive Guide for Optimal Returns
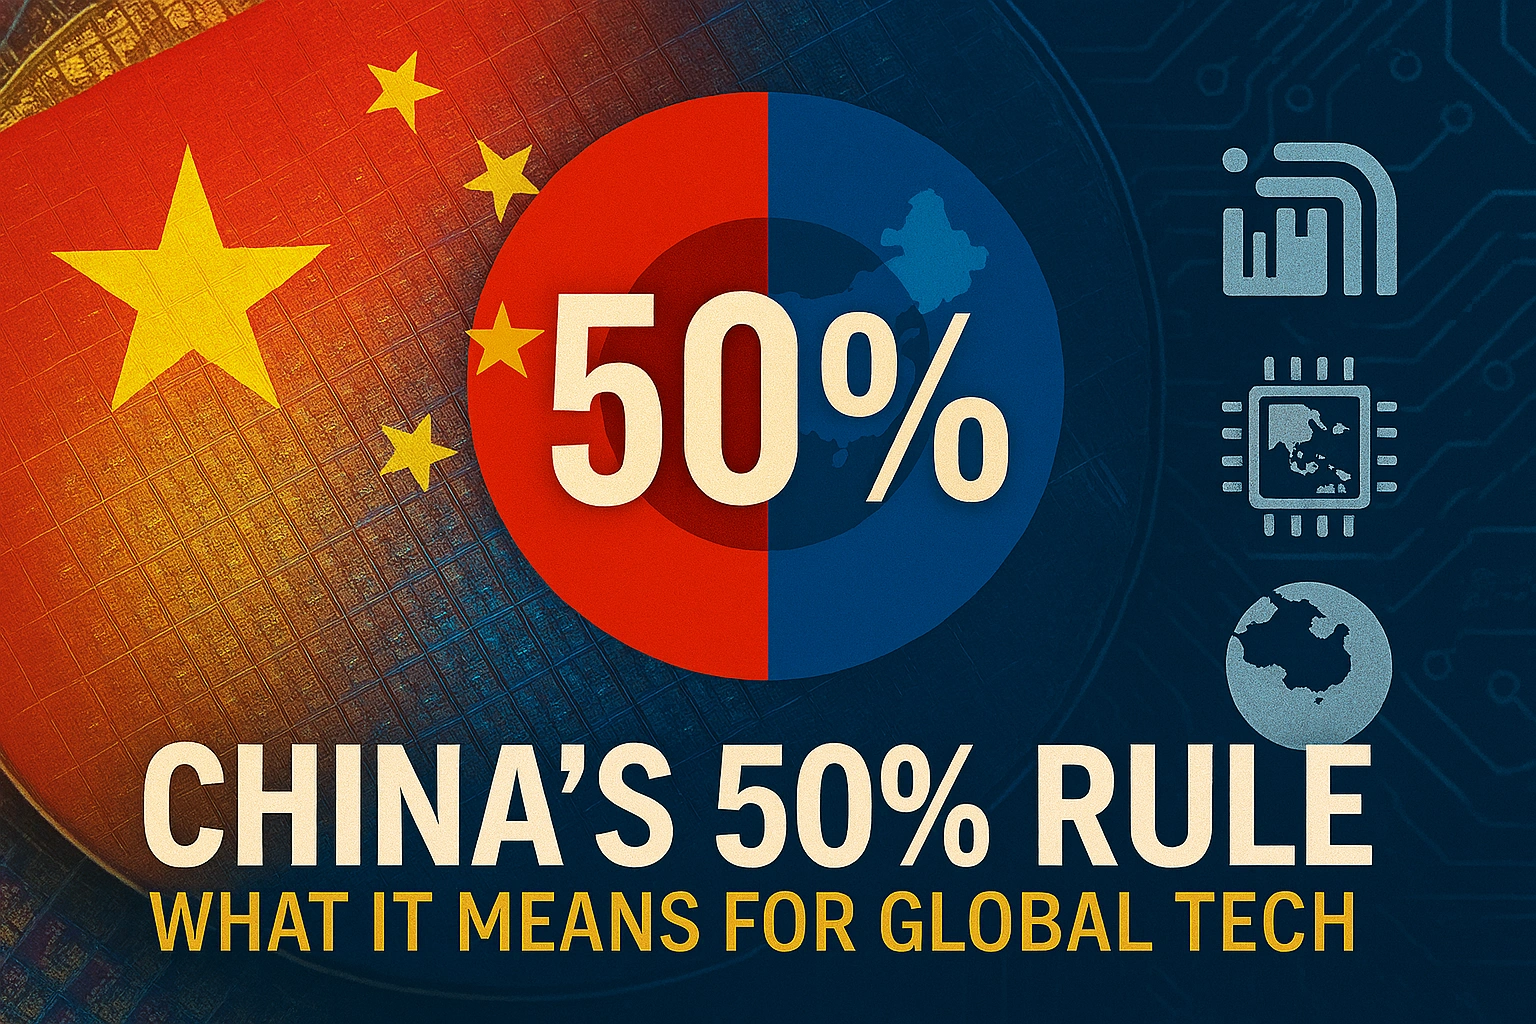
China’s 50% Domestic Equipment Rule: The Semiconductor Mandate Reshaping Global Tech
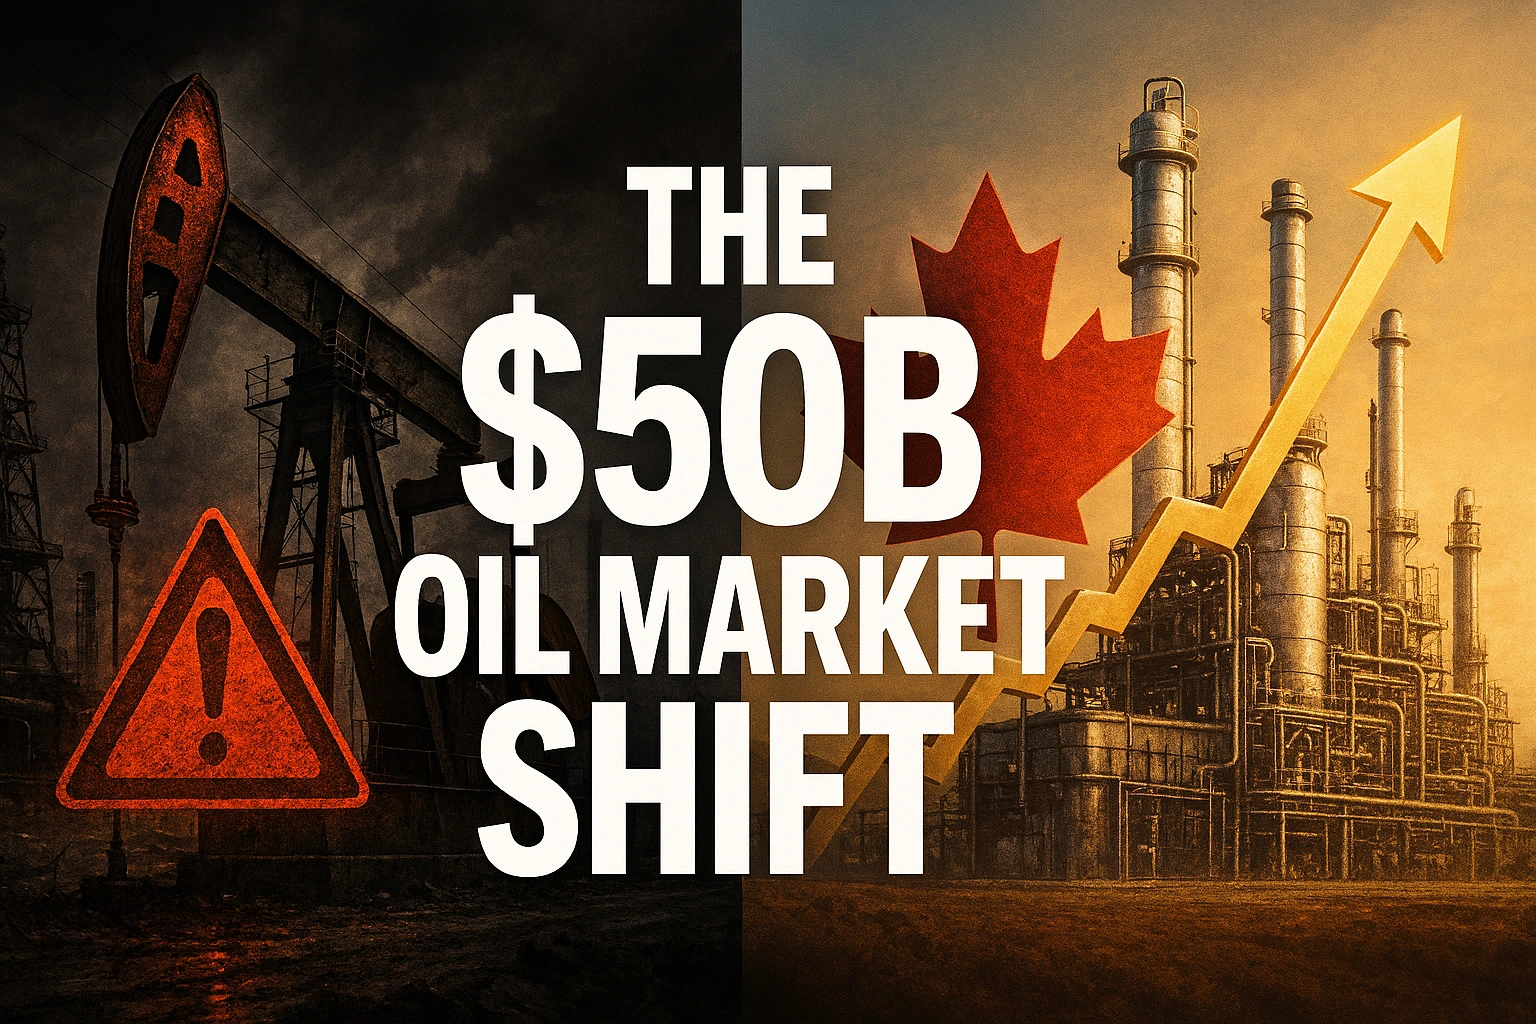
What the U.S. Attack on Venezuela Could Mean for Oil and Canadian Crude Exports: The Economic Impact

15 Most Lucrative Sectors for Investment in Pakistan: A 2025 Data-Driven Analysis

Pakistan’s Export Goldmine: 10 Game-Changing Markets Where Pakistani Businesses Are Winning Big in 2025

Pakistan’s Stock Market Renaissance: How 2025’s Hottest Investment Opportunity Is Democratizing Wealth—A Complete Beginner’s Guide
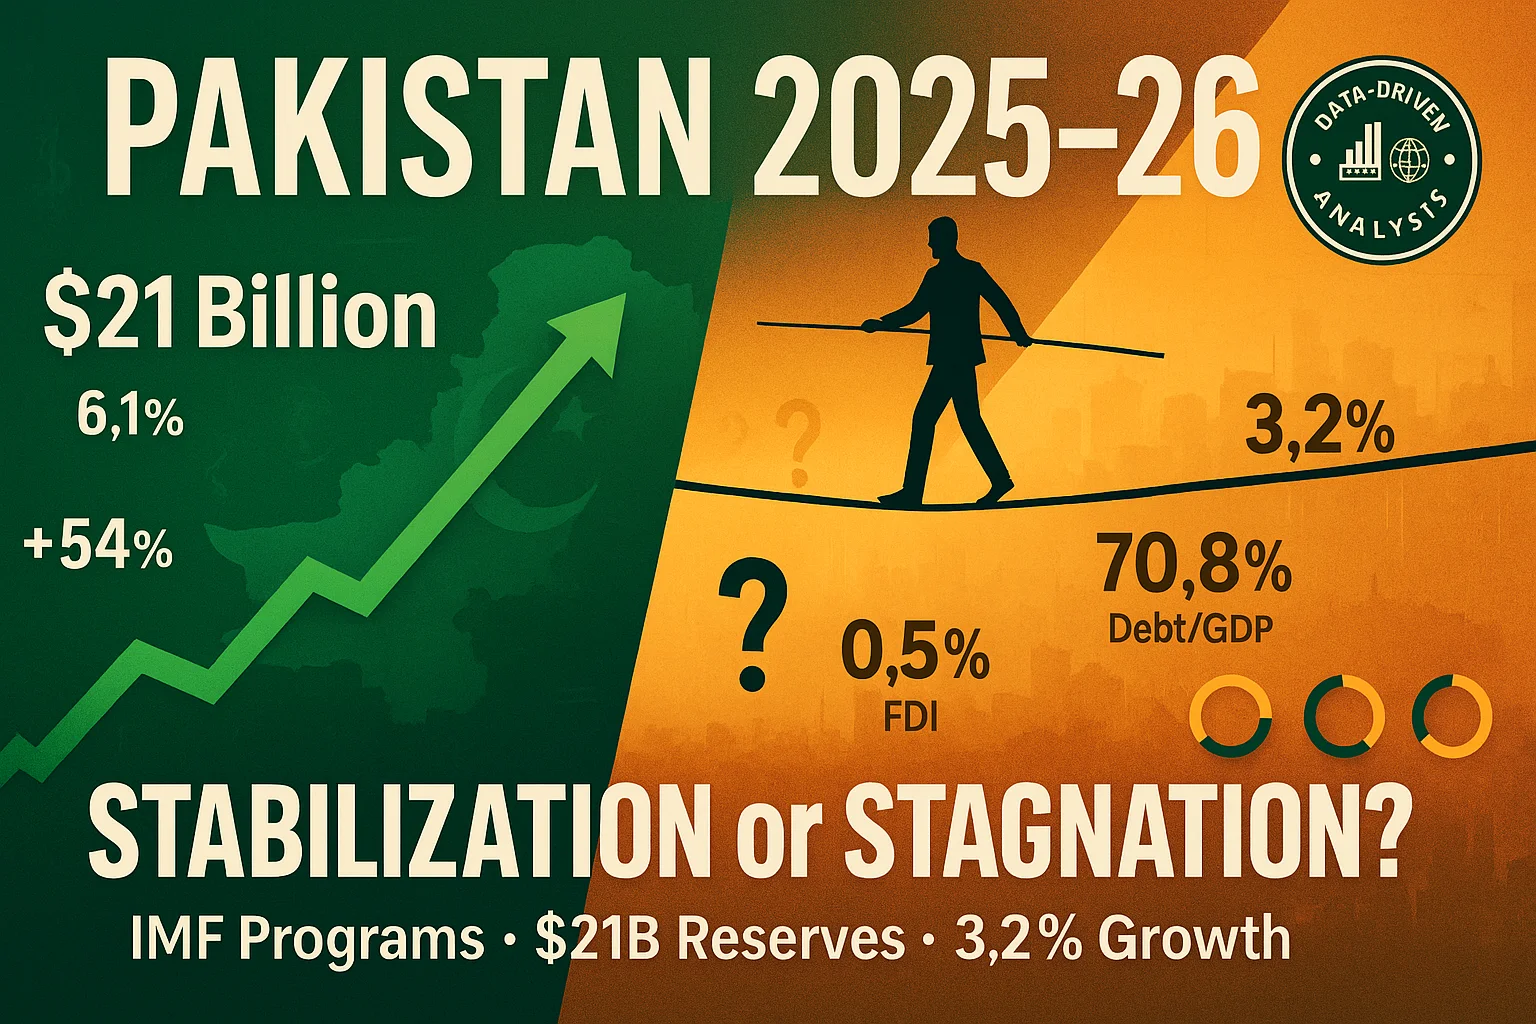
Pakistan’s Economic Outlook 2025: Between Stabilization and the Shadow of Stagnation
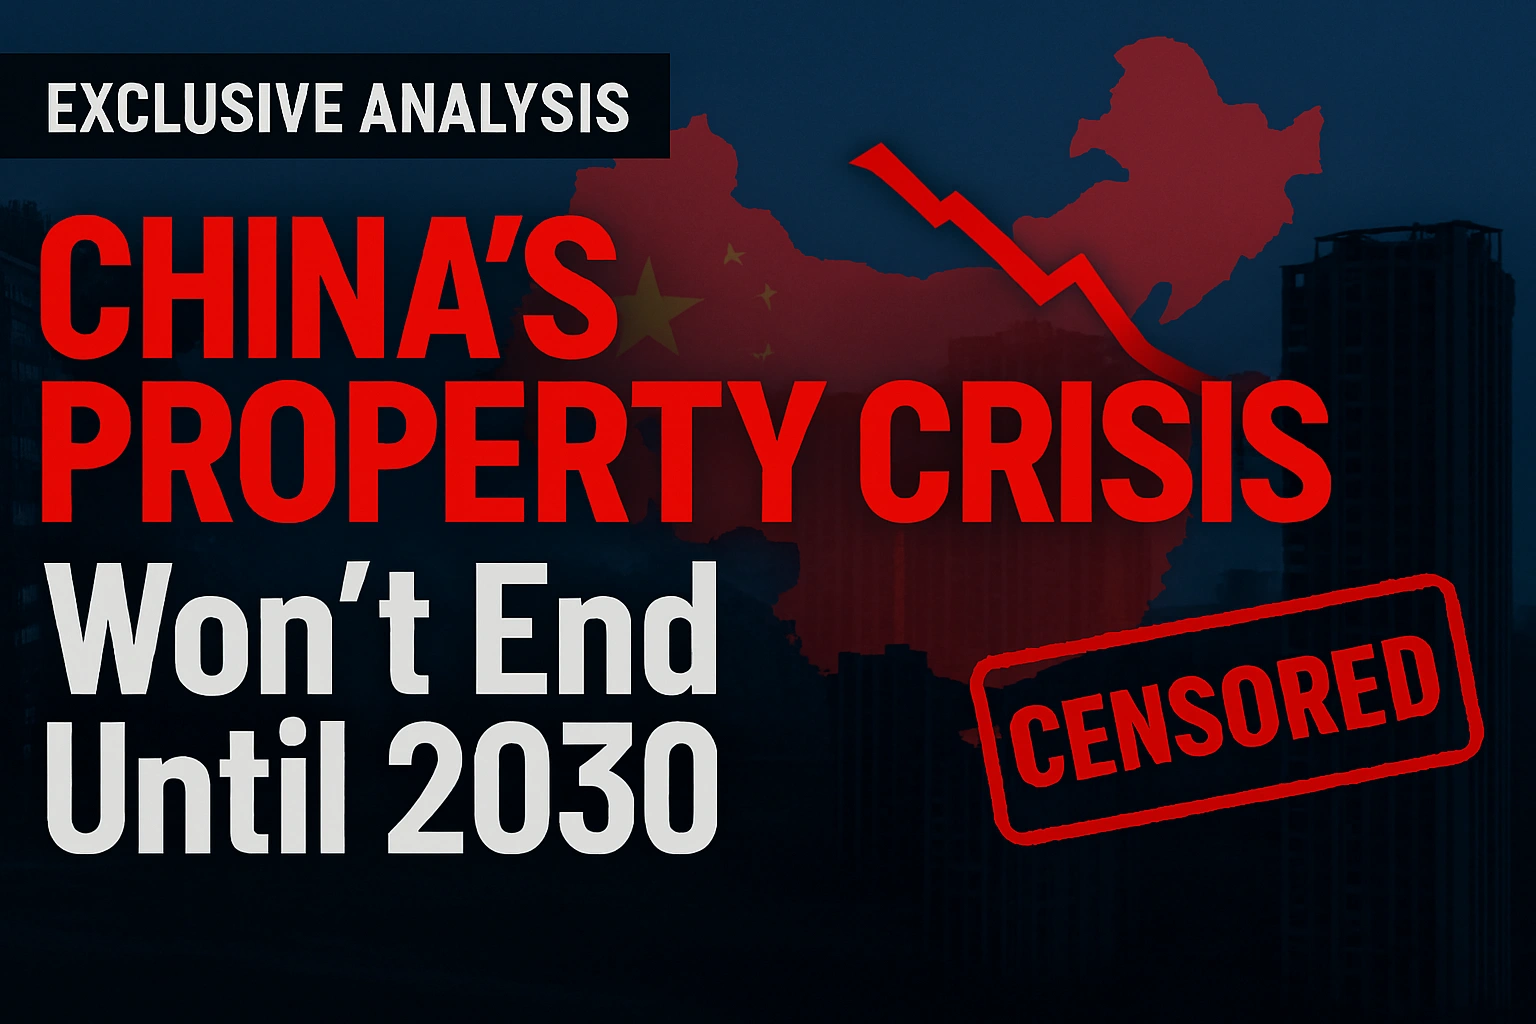
China’s Property Woes Could Last Until 2030—Despite Beijing’s Best Censorship Efforts

The Institutional Era: A Comprehensive Cryptocurrency Investment Analysis for 2026
Real Estate Crash Predictions 2026: Data-Backed Regional Guide

Best Investments in Pakistan 2026: Top 10 Low-Price Shares and Long-Term Picks for the PSX

DBS Hits S$1 Billion AI Value Milestone — But Agentic AI Poses Talent Challenges for Singapore Banks

The Contours of 21st-Century Geopolitics Will Become Clearer in 2026: A New World Is Starting to Emerge

How to Become an Active Taxpayer on Pakistan’s FBR Active Taxpayer List (ATL) in 2026: A Step-by-Step Guide

🌍 Davos 2026: The World Economic Forum Annual Meeting Sets the Stage for Global Transformation
Agentic AI in Finance: How Artificial Intelligence Is Replacing Routine Tasks on Wall Street

The New Executive Gold Standard: Top 10 Companies Lavishing Unprecedented Perks on CEOs and CFOs in 2025–2026
-
Markets & Finance10 months ago
Top 15 Stocks for Investment in 2026 in PSX: Your Complete Guide to Pakistan’s Best Investment Opportunities
-
Analysis9 months ago
Debunking IMF Program Myths: Reconfiguring Engagement for True National Ownership in a Volatile World
-
Analysis4 months ago
China Economy 2026: Property Crisis, AI Investment & Export Surplus Explained
-
Investment10 months ago
Top 10 Mutual Fund Managers in Pakistan for Investment in 2026: A Comprehensive Guide for Optimal Returns
-
Asia10 months ago
China’s 50% Domestic Equipment Rule: The Semiconductor Mandate Reshaping Global Tech
-
Global Economy10 months ago
What the U.S. Attack on Venezuela Could Mean for Oil and Canadian Crude Exports: The Economic Impact
-
AI10 months ago
15 Most Lucrative Sectors for Investment in Pakistan: A 2025 Data-Driven Analysis
-
Exports10 months ago
Pakistan’s Export Goldmine: 10 Game-Changing Markets Where Pakistani Businesses Are Winning Big in 2025