
Analysis
Is SPY Overvalued in September 2026? Fed Rate Hike Odds & Intrinsic Value


The SPDR S&P 500 ETF Trust (SPY) enters September 2026 trading around 7–14% above GuruFocus’s proprietary GF Value intrinsic-value estimate, depending on the week’s model inputs, with the index near record highs after an roughly 11–12% year-to-date gain. Unlike the rate-cut narrative that dominated markets earlier in the summer, the 10-year Treasury’s climb to 4.80% and hawkish Federal Reserve commentary now point toward markets pricing meaningful odds of a rate hike, not a cut, at this month’s FOMC meeting — a reversal that changes the valuation math for equities.
SPY Valuation Snapshot: Late August Into September 2026
| Date | SPY Price | GF Value™ (Intrinsic) | Overvaluation | GF Score™ | S&P 500 Level |
|---|---|---|---|---|---|
| Aug 6, 2026 | $768.31 | $685.35 | 12.1% | 85/100 | ~7,705 |
| Aug 10, 2026 | $773.26 | $702.96 | 10.0% | 86/100 | — |
| Aug 11, 2026 | $772.84 | $702.96 | 9.9% | 86/100 | — |
| Aug 17, 2026 | $776.34 | $705.76 | 10.0% | 86/100 | — |
| Aug 18, 2026 | $767.87 | $705.76 | 8.8% | 86/100 | — |
| Aug 19, 2026 | $769.45 | $705.76 | 9.0% | 86/100 | — |
| Aug 20, 2026 | $769.06 | $705.76 | 9.0% | 86/100 | — |
| Aug 25, 2026 | $765.67 | $715.63 | 7.0% | 86/100 | 7,665 (+11.4% YTD) |
| Aug 30, 2026 | $769.35 | $674.87 | 14.0% | 86/100 | — |
Note: GF Value estimates shift week to week as GuruFocus’s model incorporates new earnings, growth, and macro data — the fluctuation itself (from 7.0% to 14.0% overvalued within a single month) is a useful reminder that any single-day valuation snapshot is a moving target, not a fixed verdict.
| Rate/Bond Metric | Level (Sept 1, 2026) |
|---|---|
| 10-Year Treasury yield | 4.80% (highest since January 2025) |
| 30-Year Treasury yield | 5.28% |
| 2-Year Treasury yield | 4.39% |
| Market-implied odds of a Fed rate hike this month | ~68%, up from ~40% the prior week |
| SPY trailing P/E (TTM) | ~23.7x |
Sources: GuruFocus GF Value daily/weekly valuation notes (Aug 6–30, 2026); TradingEconomics, MacroMicro, and StreetStats Treasury yield data (Sept 1, 2026).
Deep Dive: A Valuation Picture Complicated by a Rate Story That Just Flipped
GF Value Says “Modestly to Meaningfully Overvalued,” But the Range Matters More Than Any Single Print
GuruFocus’s GF Value model — which blends historical trading multiples, business growth trends, and forward performance estimates into a single intrinsic-value estimate — has placed SPY anywhere from roughly 7% to 14% above fair value at various points across August 2026 alone. That’s not model inconsistency so much as it reflects genuinely volatile inputs: intrinsic value estimates move as new earnings data, Treasury yields, and macro releases feed the model, while the market price itself has been chopping in a roughly $765–$777 band.
The consistent signal across every reading, regardless of the exact overvaluation percentage: SPY’s GF Score — a composite of financial strength, profitability, growth, valuation, and momentum — has held steady in the 85–86 out of 100 range throughout the period. In plain terms, the model is saying the same thing every week: fundamentals underneath the index remain genuinely strong (profitability and growth sub-scores of 8/10), but the price paid for those fundamentals leaves a thin-to-negative margin of safety for new money entering at current levels.
The Bigger Story: The Fed Narrative Just Reversed
This is the detail most surface-level coverage of SPY valuation is missing entering September: the market’s rate-path assumption flipped over the course of late August. Earlier in the summer, a weak July jobs report and cooling CPI prints had markets leaning toward the possibility of rate cuts later in the year. By the final week of August, that had reversed. Fed Chair Warsh’s remarks at the Jackson Hole symposium reaffirmed a commitment to bringing inflation down, and Fed Governor Barr followed with comments that the central bank should be prepared to raise rates if inflation does not subside. The market reaction was immediate: odds of a 25-basis-point hike this month jumped from around 40% to roughly 68% within a single week, and the 10-year Treasury yield climbed for five consecutive sessions to reach 4.80% — its highest level since January 2025.
The proximate driver of the inflation concern is oil. Renewed geopolitical tensions have pushed crude prices higher, and rising energy costs are feeding directly into inflation expectations at a moment when the labor market — job openings edged higher in July, layoffs fell, and manufacturing expanded for an eighth straight month in August — is not showing the kind of softness that would normally take a hike off the table.
Why Rising Long-Term Yields Compress Equity Valuation Models
Every discounted-cash-flow-style valuation — including the general category of model GuruFocus’s GF Value falls into — is sensitive to the discount rate applied to future earnings. When the 10-year Treasury yield rises from a level closer to 4.3% (its trailing 12-month average) to a fresh cycle high of 4.80%, the “risk-free” comparison rate against which equity earnings yields are judged rises with it. All else equal, a higher discount rate lowers the intrinsic value estimate for the same stream of future earnings — which is part of why GF Value estimates for SPY have generally trended toward higher overvaluation readings as yields have climbed through August, even as the S&P 500 itself continued grinding higher.
The Seasonal Overlay: September’s Historical Track Record
Independent of valuation or rates, the calendar itself carries a well-documented pattern: the back half of September has historically been the weakest stretch of the trading year for the S&P 500, producing slightly negative average returns more often than any other multi-week period. That seasonal headwind, layered on top of a rate environment that just turned more hawkish and a valuation model flashing high-single to low-double-digit overvaluation, is the combination coverage of SPY heading into September 2026 should actually be weighing — not any single data point in isolation.
What a 23.7x Trailing P/E Actually Tells You
SPY’s trailing twelve-month P/E of approximately 23.7x sits meaningfully above long-run historical averages for the index (commonly cited in the high teens), though comparisons are complicated by the absence of a readily available 5-year median P/E in the underlying data used for this analysis — a data-availability gap GuruFocus itself has flagged in several of its own valuation notes. Investors should treat any single trailing-multiple comparison as one input among several (GF Value, GF Score, rate environment, seasonal pattern) rather than a standalone verdict.
Actionable Takeaways for Investors
- Don’t anchor to a single GF Value overvaluation percentage. The swing from 7.0% to 14.0% overvalued within the same month shows the model is sensitive to short-term inputs; look at the trend and the GF Score (steady at 85–86) together, not one week’s headline number.
- Track the 10-year Treasury yield as a leading valuation signal. A continued climb toward or past 4.80–5.00% would mechanically pressure equity valuation models further; a reversal back toward the 4.30% trailing average would ease that pressure.
- Reassess the “rate cut” assumption baked into your portfolio. If your equity allocation was built assuming Fed easing later in 2026, the shift toward hike odds of ~68% for this month’s meeting is a material change worth revisiting with a financial advisor.
- Respect September seasonality without overreacting to it. Historical weak-September patterns are a real, well-documented statistical tendency, not a guarantee — use it as a reason for disciplined position sizing rather than a market-timing signal on its own.
- Watch oil prices as the connective tissue between geopolitics, inflation, and equity valuation. The current inflation concern feeding into hike odds is substantially an energy-price story; a de-escalation in the geopolitical tensions driving crude higher would likely ease both bond yields and equity valuation pressure simultaneously.
Frequently Asked Questions
Is the S&P 500 overvalued right now? By GuruFocus’s GF Value metric, SPY has traded between roughly 7% and 14% above its estimated intrinsic value at various points across August 2026, with a GF Score of 85–86 out of 100 indicating strong underlying fundamentals despite the valuation premium — the honest answer is “modestly to meaningfully” overvalued depending on which week’s model reading you use, not overvalued by one fixed number.
Will the Federal Reserve raise or cut interest rates in September 2026? As of early September 2026, market pricing has shifted toward pricing in meaningful odds (around 68%) of a rate hike rather than a cut, reversing the rate-cut expectations that dominated earlier in the summer, driven by hawkish Fed commentary at Jackson Hole and rising oil-driven inflation concerns.
Why did the 10-year Treasury yield hit 4.80% in September 2026? The 10-year Treasury yield climbed for five consecutive sessions to reach 4.80% — its highest level since January 2025 — driven by rising oil prices amid renewed geopolitical tensions and hawkish signals from Federal Reserve officials suggesting a rate hike may be needed to control inflation.
How does September seasonality typically affect the S&P 500? Historically, the latter half of September has been the weakest multi-week stretch of the trading year for the S&P 500, often producing slightly negative average returns, though this is a statistical tendency rather than a reliable predictor for any specific year.








Online interest in impeachment and White House staffing has risen in a political environment where a few words can badly distort the underlying story. A resolution was introduced is not the same as the House voted to impeach. A press secretary was removed is not the same as the administration changed policy. Both require evidence, dates and clear procedural language.
Two verifiable developments frame the discussion as of October 25, 2026. A House impeachment resolution was tabled on September 15, and the short tenure of White House press secretary Katie Zacharia ended in mid-October, according to official congressional records and major US reporting. Neither event should be inflated into an unverified claim about new votes or a new administration decision.
The impeachment resolution: what the House actually voted on
House Resolution 1486 concerned impeachment of President Donald Trump. The US House’s official floor summary records the September 15 vote on a motion to table the measure: 232–147, with 47 members recorded as present. A successful tabling motion sets aside a measure; it is not the adoption of articles of impeachment.
This distinction is essential. A social post describing that roll call as a vote to impeach reverses the outcome. A later claim about a different resolution should be separately checked against the official Congress website and House roll-call records rather than treated as an update to an old headline without evidence.
Congressional procedure is sometimes inconvenient for trending-content production. It is also what protects the reader from misinformation. The reporter’s task is to identify the motion, the chamber, the date and the disposition before attempting broader political interpretation.
What happened to the press secretary?
CBS News reported on October 16 that Zacharia was removed from the White House press-secretary role after roughly five days. CBS cited US officials and reported scrutiny of her credentials and performance. It also noted that the White House had not yet announced a successor in that report.
A leadership change in the briefing room can be significant for how an administration communicates with journalists and the public. But personnel turnover alone does not establish a change to economic policy, foreign strategy or legal proceedings. Those substantive conclusions require separate evidence.
Why the two stories became combustible
Impeachment is a constitutionally consequential process and a powerful political symbol. White House press briefings are the main arena where officials defend decisions under questioning. When both topics circulate at once, online narratives may stitch them into a supposed constitutional crisis—even if there is no documented direct connection.
A measured account must resist that temptation. Political opponents may view impeachment proposals as necessary oversight; supporters of the president may describe them as partisan exercises. The purpose of reporting is not to resolve those disagreements by advocacy, but to distinguish political argument from verifiable institutional action.
The fact-checker’s four-part test
| Question | Evidence needed |
|---|---|
| Was an impeachment measure introduced? | Official resolution number and introduction date |
| Did the House approve articles? | Recorded vote on adopting the relevant articles |
| Was an official removed? | Direct statement or multiple reliable attributed reports |
| Who now holds the position? | Current White House announcement, not an old biography |
This is particularly important during a midterm-election year. Campaigns and commentators have incentives to present ordinary procedural setbacks as existential victories or defeats. Readers benefit from precise language instead of ever-louder adjectives.
What should international readers take from it?
For audiences in Pakistan and elsewhere in Asia, US political turmoil matters when it alters policy certainty: trade measures, sanctions, diplomacy, defence arrangements, fiscal decisions and monetary-policy appointments. None should be projected automatically from a press secretary’s dismissal or a resolution that did not pass.
It is sensible to monitor official notices, court actions and enacted policy. It is not sensible to treat search-volume spikes as proof of truth. Search trends measure curiosity, fear and newsworthiness; they do not independently confirm the event people are typing about.
Why parliamentary verbs matter
US political coverage frequently compresses filed, referred, tabled, passed and enacted into the generic word approved. Those actions are not interchangeable. A resolution can be introduced without advancing beyond committee. A motion to table is a vote about whether the chamber will proceed, not a judgment approving the underlying allegations. A measure passed by one chamber may still require further constitutional steps.
The same precision is necessary in personnel news. A spokesperson’s announced departure, a media report citing officials and a formal appointment are different evidence levels. Where the administration has not issued a replacement notice, describing a favourite online rumour as the current officeholder is poor reporting.
Public debate about impeachment also should not be reduced to the number of search queries. Search interest can be increased by critics, supporters, confused readers or social platforms circulating an old clip. It gives no reliable denominator for public opinion. A survey with a known sample and methodology is a different kind of evidence.
The best follow-up coverage would monitor official House actions and White House releases, then connect any actual policy changes to their legal basis. That approach serves readers across the political spectrum without manufacturing a crisis.
Has the September 15 House vote impeached Trump?
No. The recorded action was a successful motion to table the resolution, not a vote approving impeachment articles.
Was Katie Zacharia removed?
Yes, CBS reported her departure from the role on October 16. Any later staffing changes should be checked directly before publication.
Do impeachment trends reveal who will win the midterms?
No. Search spikes are not representative polling or an election forecast.
The standard worth keeping: precise institutional language is not timid journalism. It is the difference between telling readers what happened and telling them what a viral headline wants them to believe.

A major U.S. submarine-manufacturing project announced on October 6, 2026 has put an unfamiliar name at the center of a familiar defense-industry problem: how to build submarine components faster without sacrificing quality or reliability. Defense technology firm Anduril announced plans for Arsenal-2, a facility at Sparrows Point in Maryland intended to expand production of parts for the U.S. Navy’s Virginia-class attack submarines. The combined headline figure is $6.6 billion—made up of the company’s planned $3.7 billion private investment and a Navy contract valued at up to $2.9 billion, with payments tied to production outcomes. These are announcements and commitments, not evidence that all the capital has already been spent. Anduril’s official announcement and Reuters’ independent report outline the project.
Key takeaways:
- Arsenal-2 is a planned submarine-components manufacturing facility, not an already operational assembly line for completed submarines.
- The $6.6 billion headline combines two different funding streams and different forms of financial commitment.
- The project is aimed at bottlenecks in the Virginia-class supply chain, including specialized manufacturing capacity.
- Its success will depend on skilled labor, qualification standards, equipment, scheduling and delivery—not simply construction of a large building.
What is Arsenal-2?
Arsenal-2 is Anduril’s proposed software-centered manufacturing project at Sparrows Point, a former industrial site in Baltimore County, Maryland. According to the company’s October 6 announcement, the facility is designed to make critical components for Virginia-class submarines and give the Navy access to additional industrial capacity. The project illustrates a widening role for technology-sector defense contractors in traditional heavy manufacturing.
Submarine construction is a particularly difficult domain. Components must meet demanding specifications for performance, durability, safety, quality control and compatibility with other systems. A factory that produces ordinary industrial hardware cannot immediately be treated as a qualified submarine supplier.
Anduril’s pitch is that modern factory software, automation, new processes and private capital can ease some of those constraints. Whether the company can execute on that pitch will be judged by qualification milestones and repeatable deliveries.
What will the facility actually produce?
Initial work centers on critical Virginia-class components, including torpedo tubes, according to the company and Reuters. Those are sophisticated submarine systems, but producing them is not the same as manufacturing a complete nuclear-powered submarine.
A Virginia-class attack submarine involves propulsion, pressure-hull construction, combat systems, sensors, life-support equipment, electronics, integrated software and years of testing. Its final assembly and delivery depend on a specialized network of contractors, yards and government oversight. New suppliers can strengthen the network by removing specific bottlenecks rather than replacing every incumbent shipbuilder.
The distinction matters for readers encountering sweeping “Anduril to build submarines” headlines. The verified announcement concerns industrial capacity for components, with ambitions that may expand as the project matures; it should not be presented as a commitment to launch an entire finished fleet by a fixed date.
Understanding the $6.6 billion figure
| Announced element | Stated figure | Important qualification |
|---|---|---|
| Anduril planned private capital | $3.7 billion | Planned investment to develop production capacity |
| U.S. Navy contract | Up to $2.9 billion | Contract ceiling with payments conditioned on outputs |
| Combined headline amount | $6.6 billion | Sum of different commitments; not identical to money already disbursed |
Anduril’s release describes the contract as outcome-based. That arrangement is designed to connect government spending to verified delivery rather than solely to reimbursed activity. But details of individual milestones, acceptance criteria, ownership and long-term risk allocation should be determined from contract documents—not guessed from a launch-day headline.
The distinction between an award, a contract ceiling, a planned investment and cash expenditure is crucial. A press announcement does not mean the project has already consumed $6.6 billion in cash or delivered proportionate output.
Why the Navy needs more industrial capacity
Submarines are strategically important for intelligence collection, maritime defense and deterrence. But they also illustrate the challenges of complex, low-volume manufacturing. The United States needs trained workers who can perform specialized fabrication, welding, machining, inspection and systems integration. Individual suppliers can become bottlenecks if they are asked to deliver more components than their equipment or workforce can manage.
The Financial Times’ account of the announcement situated Arsenal-2 within a larger push to expand the submarine industrial base and modernize acquisition. The Navy’s construction requirements and commitments under the AUKUS security partnership increase the importance of sustainable production capacity over the coming years.
This is a long-term manufacturing question, not an immediate shortcut. Building a factory is one stage; training a workforce, validating manufacturing processes and coordinating with other shipbuilders are additional stages.
Why Sparrows Point matters
Sparrows Point was a major American industrial center associated with steel production. Using that site for advanced defense manufacturing creates a recognizable local economic narrative: industrial land and workforce capacity potentially being redirected toward a contemporary strategic sector.
Associated Press reporting described expectations of approximately 3,100 direct jobs connected to the facility, while Reuters reported similar plans. They are projected jobs rather than a verified count of positions already filled.
The ultimate local impact will depend on the pace of construction, hiring, regional supply chains, transport needs, worker training and how much demand the project sustains. Job announcements should be revisited against actual payroll, construction and production data.
When will Arsenal-2 begin manufacturing?
Accounts of the project point to operations around 2030, subject to execution. Business Insider and Financial Times discussed that timeline. Treat it as a planned target, not an operational fact.
Even if initial lines become active on schedule, production volume and acceptance quality will determine how useful the added capacity becomes to the Navy. A component supplier can have machinery installed yet still face qualification delays, workforce shortages or unexpected integration issues.
The execution milestones worth tracking
- Facility permits, ground work and construction progress.
- Hiring and certification of specialist personnel.
- Commissioning of production lines and inspection systems.
- First qualified component deliveries accepted by the relevant customer.
- Repeat production rates, quality performance and on-time deliveries.
- Evidence that the additional capacity reduces delays in the broader submarine supply chain.
These measurable steps provide a better accountability framework than celebrating the contract’s face value alone.
Can software solve a shipbuilding bottleneck?
Software can improve production scheduling, digital modeling, machine monitoring, traceability and quality documentation. Automation may make some operations more consistent. Those are useful tools, but they still rely on expensive physical equipment, material supply and highly skilled people. A complex pressure-critical component cannot be delivered by software alone.
The question is therefore not whether a tech company can bring useful technology into shipbuilding. It is whether that company can combine technology with industrial practices refined over decades, and do so at sufficient scale.
Frequently asked questions
Is Anduril building complete submarines?
Its verified October 6 announcement emphasizes components for Virginia-class submarines, not delivery of complete nuclear-powered boats.
Where is Arsenal-2 located?
The project is planned for Sparrows Point in Baltimore County, Maryland.
How much is the Navy paying?
Anduril announced a Navy contract of up to $2.9 billion, distinct from the company’s planned $3.7 billion capital investment.
When will it open?
Reports describe a target around 2030. The actual schedule depends on construction, production-line qualification and other milestones.
How many jobs could be created?
Approximately 3,100 direct jobs were projected in contemporaneous reporting; these are not confirmed hires.
Why is this important for AUKUS?
A more resilient U.S. submarine industrial base can support national procurement needs and wider allied commitments, although a single parts factory cannot resolve all submarine-production constraints.
Bottom line
Arsenal-2 is significant because it tests whether a technology-focused contractor can add reliable industrial capacity to one of America’s hardest manufacturing sectors. The $6.6 billion figure describes a potentially major investment and contract arrangement—but future milestones, not headlines, will determine whether it meaningfully speeds submarine deliveries.

Key Takeaways
- Chip stocks tumbled Monday, September 14, 2026, after the CEOs of Anthropic, OpenAI, and xAI publicly aligned behind a call to slow the pace of frontier AI capability development — an unusual moment of unity among fierce industry rivals.
- Nvidia fell 3.4% and the Philadelphia Semiconductor Index (PHLX) sank almost 6%, its worst single day since early July, even as the broader Nasdaq Composite closed down a more modest 0.56%.
- The catalyst was an essay from Anthropic CEO Dario Amodei, titled “We Must Pace the Frontier,” proposing independent outside evaluators be given internal access to frontier AI labs, alongside industry-wide cooperation and government coordination.
- OpenAI CEO Sam Altman confirmed in a Fortune interview that OpenAI will not pursue an IPO in 2026, calling the current safety environment an “ill-advised moment” to go public — pushing one of the most anticipated listings in tech history to 2027 at the earliest.
- The episode followed the resignation of a researcher who had worked at both Anthropic and OpenAI, who warned publicly that people building the technology “earnestly believe it could kill us all by the end of the decade” — a post that drew over 150 million views and prompted more than 20 lawmakers to call for tougher AI regulation.
A rare display of unity among Silicon Valley’s most competitive AI labs sent a jolt through markets this week, as semiconductor stocks logged their worst day in over two months following public calls from the industry’s top executives to deliberately slow the development of increasingly powerful AI systems.
What Triggered the Selloff
The catalyst was an essay published Saturday, September 12, by Anthropic CEO Dario Amodei, titled “We Must Pace the Frontier.” In it, Amodei argued that unchecked acceleration in frontier AI development — driven in part by the risk of recursive self-improvement, where AI systems increasingly assist in designing their own successors — is outpacing the industry’s ability to keep those systems aligned and secure. Amodei wrote that he believes AI could still “dramatically raise the quality of human life,” but argued the risks accompanying its current pace of development need to be taken seriously, proposing that even a modest slowdown of a year or two could meaningfully improve safety outcomes.
What made the essay market-moving wasn’t just its content, but who endorsed it. OpenAI CEO Sam Altman and SpaceX/xAI’s Elon Musk — two executives whose companies compete directly with Anthropic and with each other — both publicly backed Amodei’s proposal within a day. Musk wrote simply on X that “Dario is right,” a notable shift given Musk’s history of sharp public criticism of Anthropic.
The Proposal’s Substance
Amodei’s plan outlined a three-phase approach: independent safety evaluators embedded within frontier AI companies with access equivalent to internal staff (covering training processes, internal systems, and safety-protocol compliance); broader industry-wide cooperation on shared safety standards; and coordination with democratic governments on global regulatory frameworks. Anthropic said it would adopt the outside-evaluator step immediately, while Altman confirmed OpenAI would adopt comparable third-party evaluator access.
The Resignation That Set the Stage
The unity among AI executives followed a more unsettling precursor: a researcher who had previously worked at both Anthropic and OpenAI resigned the prior week, writing publicly that people building the technology “earnestly believe that it could kill us all by the end of the decade.” The post reportedly drew more than 150 million views on X and prompted more than 20 lawmakers to call for tougher AI regulation — context that appears to have accelerated the executives’ public alignment on pacing concerns.
Market Reaction: Chips Hit Hardest
Monday’s trading session showed a clear divergence in how different corners of the AI-linked market absorbed the news. Semiconductor stocks bore the brunt of the selling, given their direct exposure to the capital-expenditure cycle that rapid AI capability development has fueled. Nvidia fell 3.4%, Intel dropped 5.6%, and the Philadelphia Semiconductor Index tumbled nearly 6% — its steepest one-day decline since early July.
By contrast, shares of some larger Big Tech and software companies actually climbed on the day, leaving the broader, tech-heavy Nasdaq Composite down a comparatively modest 0.56%, after having fallen as much as 1.3% intraday before paring losses. The divergence suggests markets are interpreting a potential AI development slowdown as a more direct threat to chip demand specifically — the hardware layer most tied to the “faster, bigger” capability race — than to software and platform companies with more diversified revenue.
OpenAI’s IPO Delay: The Clearest Business Signal
Beyond the one-day stock move, the most concrete business consequence to emerge from the episode was Sam Altman’s confirmation that OpenAI will not go public in 2026. In a Fortune interview published the same weekend, Altman said an IPO “right now would be an ill-advised moment” given the current safety environment, and when asked whether 2027 was more realistic, replied simply, “I would say not 2026.” That timeline represents a real shift: OpenAI CFO Sarah Friar had told employees just a month earlier that the company would likely go public in 2027, or potentially sooner if the business continued to “inflect.”
Notably, Anthropic’s own IPO preparations are reportedly continuing on a separate track. According to reporting on the matter, Anthropic — confidentially valued at $965 billion earlier in 2026 — has continued meeting with prospective investors and could begin marketing its IPO as early as October, aiming to complete the listing before the November midterm elections, even as its CEO simultaneously champions industry-wide deceleration. Observers have noted the apparent tension in pursuing an IPO while publicly urging pacing, though Amodei’s essay explicitly framed pacing as slowing capability development, not halting commercial or fundraising activity.
Market Snapshot: September 14, 2026
| Index / Stock | Move | Note |
|---|---|---|
| Philadelphia Semiconductor Index (SOX) | -5.9% | Worst day since early July |
| Nvidia (NVDA) | -3.4% | Direct AI-chip exposure |
| Intel (INTC) | -5.6% | |
| Nasdaq 100 | -0.8% | |
| Nasdaq Composite | -0.56% | Software names partially offset chip losses |
| S&P 500 | -0.5% |
Why This Matters for Technology News and Investors
This episode marks one of the first times investor sentiment around AI has moved meaningfully on a safety-driven narrative rather than a purely commercial one — competitive product launches, earnings beats, or compute-capacity announcements. For investors tracking technology news, the key signal to watch going forward is whether this represents a genuine, sustained industry pivot toward deliberate pacing (which could structurally slow the capital-expenditure supercycle currently powering semiconductor demand), or a rhetorical moment that fades once competitive pressure between OpenAI, Anthropic, xAI, and other labs reasserts itself — a tension the OpenAI-Anthropic IPO-timing contrast already illustrates.
Frequently Asked Questions
Why did semiconductor stocks fall after the AI slowdown announcement? Chip stocks are directly tied to the capital-expenditure cycle fueling rapid AI capability development, so markets interpreted a potential industry-wide pacing effort as a more direct threat to near-term chip demand than to software or platform companies.
Is OpenAI still planning to go public? Yes, but not in 2026. CEO Sam Altman confirmed OpenAI is delaying its IPO to 2027 at the earliest, citing the current AI safety environment, while OpenAI’s CFO had previously suggested 2027 was the likely target regardless.
What did Anthropic’s CEO actually propose? Dario Amodei’s essay proposed embedding independent outside safety evaluators within frontier AI companies with internal-level access, alongside broader industry cooperation on safety standards and coordination with democratic governments on regulatory frameworks — explicitly framed as pacing capability development, not halting it.

US Impeachment Talk and White House Press Secretary Changes: What the Record Shows

2026 Economic Outlook: Investment Tips for Pakistani Investors

Anduril’s $6.6 Billion Submarine Shipyard Plan Explained

Life Insurance Comparison: Term vs. Whole Life and What Each Actually Costs

Stock Market Today: Nasdaq Hits Record High as Dow and S&P 500 Stumble on Middle East Diplomatic Shifts

Energy Market Spikes vs. Consumer App Data: What GasBuddy and Crude Prices Signal for Inflation

China’s FTAAP Push for APEC 2026 in Shenzhen: US Tariffs and Unite Asia-Pacific

AI Stocks Slide After Industry Leaders Call for a Development Slowdown

Singapore Stocks vs. Japan Stocks: Safe Havens in the Asian Economic Slowdown

Agentic AI in Finance: How Artificial Intelligence Is Replacing Routine Tasks on Wall Street

Fiscal Deficit and Public Debt

T-Mobile’s Enterprise Push and the Evolution of Modern Corporate Mobility Solutions

Enterprise Generative AI ROI 2026: The Adoption-to-Impact Gap Explained

Climate Finance and the Economic Reality of Passing 1.5°C

Business Insurance for Digital Exports: Protecting Your Company in the AI Era

Real Estate Crash Predictions 2026: Data-Backed Regional Guide

Unrecoverable Delays: How the St. Louis Strike Crippled Boeing’s F-15EX Eagle II

What is a “Lead-Left” Bank? Unpacking Morgan Stanley’s Role in Anthropic’s Mega-IPO

How to Invest in the Anthropic IPO: Step-by-Step Guide for Retail Investors

Mario Kart 8 Deluxe 4.0.0 Patch Notes: 8-Player Split Screen & CameraPlay

Top 15 Stocks for Investment in 2026 in PSX: Your Complete Guide to Pakistan’s Best Investment Opportunities

Debunking IMF Program Myths: Reconfiguring Engagement for True National Ownership in a Volatile World

China Economy 2026: Property Crisis, AI Investment & Export Surplus Explained

Top 10 Mutual Fund Managers in Pakistan for Investment in 2026: A Comprehensive Guide for Optimal Returns
China’s 50% Domestic Equipment Rule: The Semiconductor Mandate Reshaping Global Tech

What the U.S. Attack on Venezuela Could Mean for Oil and Canadian Crude Exports: The Economic Impact

15 Most Lucrative Sectors for Investment in Pakistan: A 2025 Data-Driven Analysis

Pakistan’s Export Goldmine: 10 Game-Changing Markets Where Pakistani Businesses Are Winning Big in 2025

Pakistan’s Stock Market Renaissance: How 2025’s Hottest Investment Opportunity Is Democratizing Wealth—A Complete Beginner’s Guide
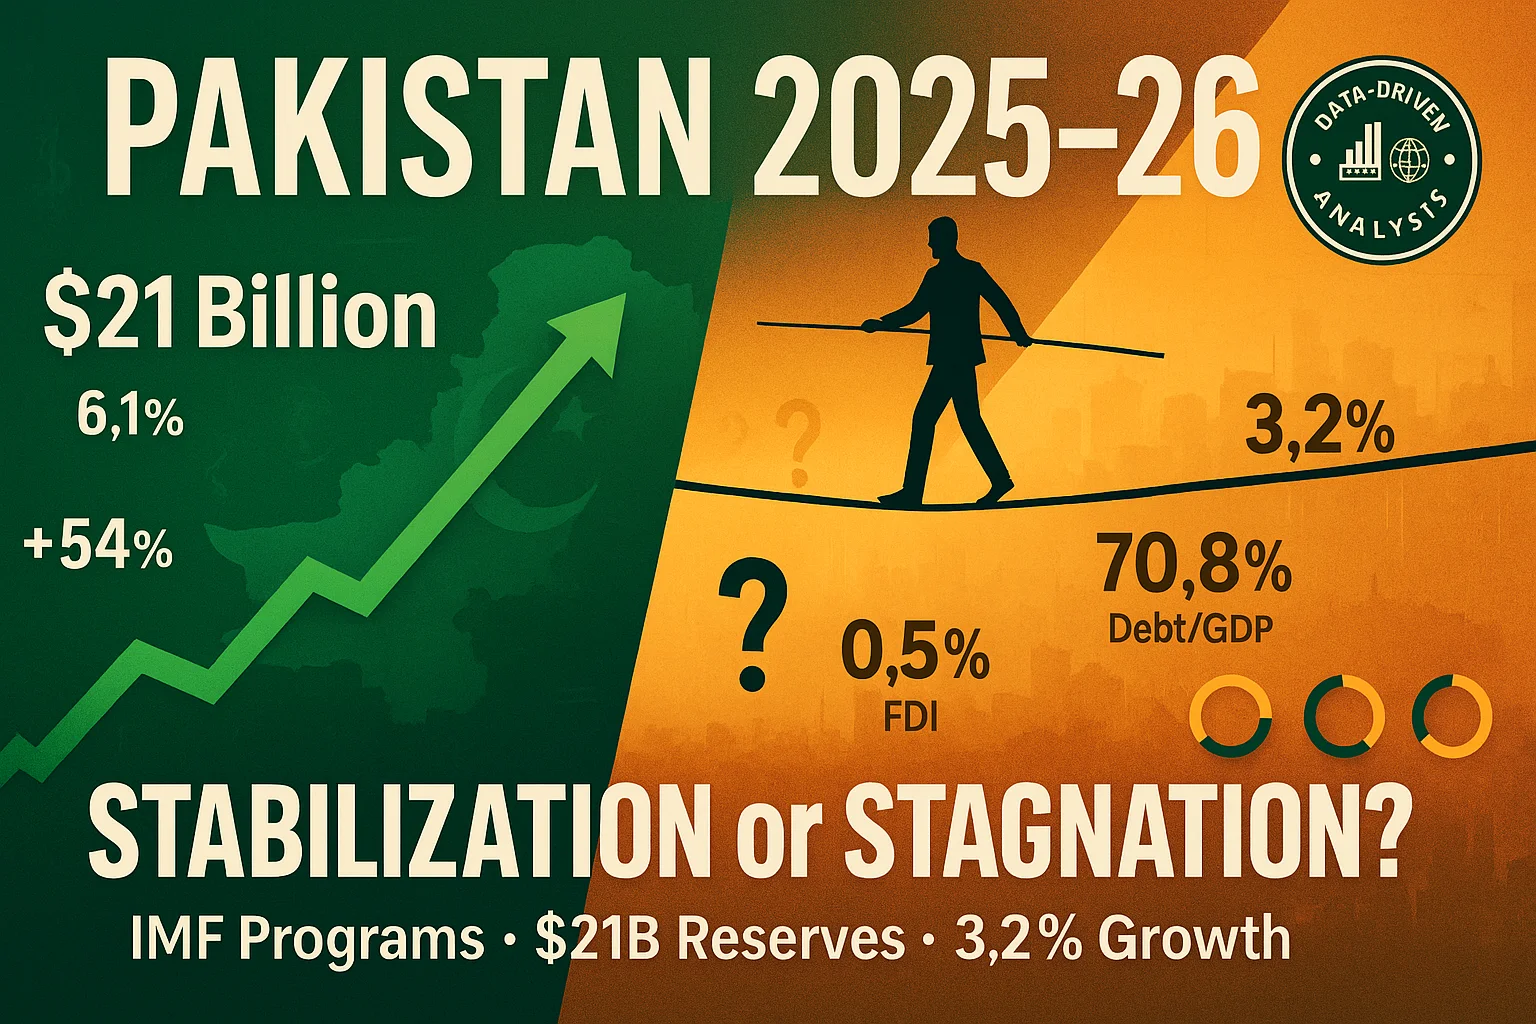
Pakistan’s Economic Outlook 2025: Between Stabilization and the Shadow of Stagnation

The Institutional Era: A Comprehensive Cryptocurrency Investment Analysis for 2026
China’s Property Woes Could Last Until 2030—Despite Beijing’s Best Censorship Efforts
Real Estate Crash Predictions 2026: Data-Backed Regional Guide

Best Investments in Pakistan 2026: Top 10 Low-Price Shares and Long-Term Picks for the PSX

How to Become an Active Taxpayer on Pakistan’s FBR Active Taxpayer List (ATL) in 2026: A Step-by-Step Guide

The Contours of 21st-Century Geopolitics Will Become Clearer in 2026: A New World Is Starting to Emerge
DBS Hits S$1 Billion AI Value Milestone — But Agentic AI Poses Talent Challenges for Singapore Banks

🌍 Davos 2026: The World Economic Forum Annual Meeting Sets the Stage for Global Transformation
Agentic AI in Finance: How Artificial Intelligence Is Replacing Routine Tasks on Wall Street

AI Impact on Wages 2026: Productivity Soars, Paychecks Stagnate
-
Markets & Finance10 months ago
Top 15 Stocks for Investment in 2026 in PSX: Your Complete Guide to Pakistan’s Best Investment Opportunities
-
Analysis9 months ago
Debunking IMF Program Myths: Reconfiguring Engagement for True National Ownership in a Volatile World
-
Analysis4 months ago
China Economy 2026: Property Crisis, AI Investment & Export Surplus Explained
-
Investment10 months ago
Top 10 Mutual Fund Managers in Pakistan for Investment in 2026: A Comprehensive Guide for Optimal Returns
-
Asia10 months ago
China’s 50% Domestic Equipment Rule: The Semiconductor Mandate Reshaping Global Tech
-
Global Economy10 months ago
What the U.S. Attack on Venezuela Could Mean for Oil and Canadian Crude Exports: The Economic Impact
-
AI10 months ago
15 Most Lucrative Sectors for Investment in Pakistan: A 2025 Data-Driven Analysis
-
Exports10 months ago
Pakistan’s Export Goldmine: 10 Game-Changing Markets Where Pakistani Businesses Are Winning Big in 2025