
Global Economy
15 Strategic Pathways to Accelerate Pakistan’s GDP Growth: A Policy Roadmap for Economic Transformation

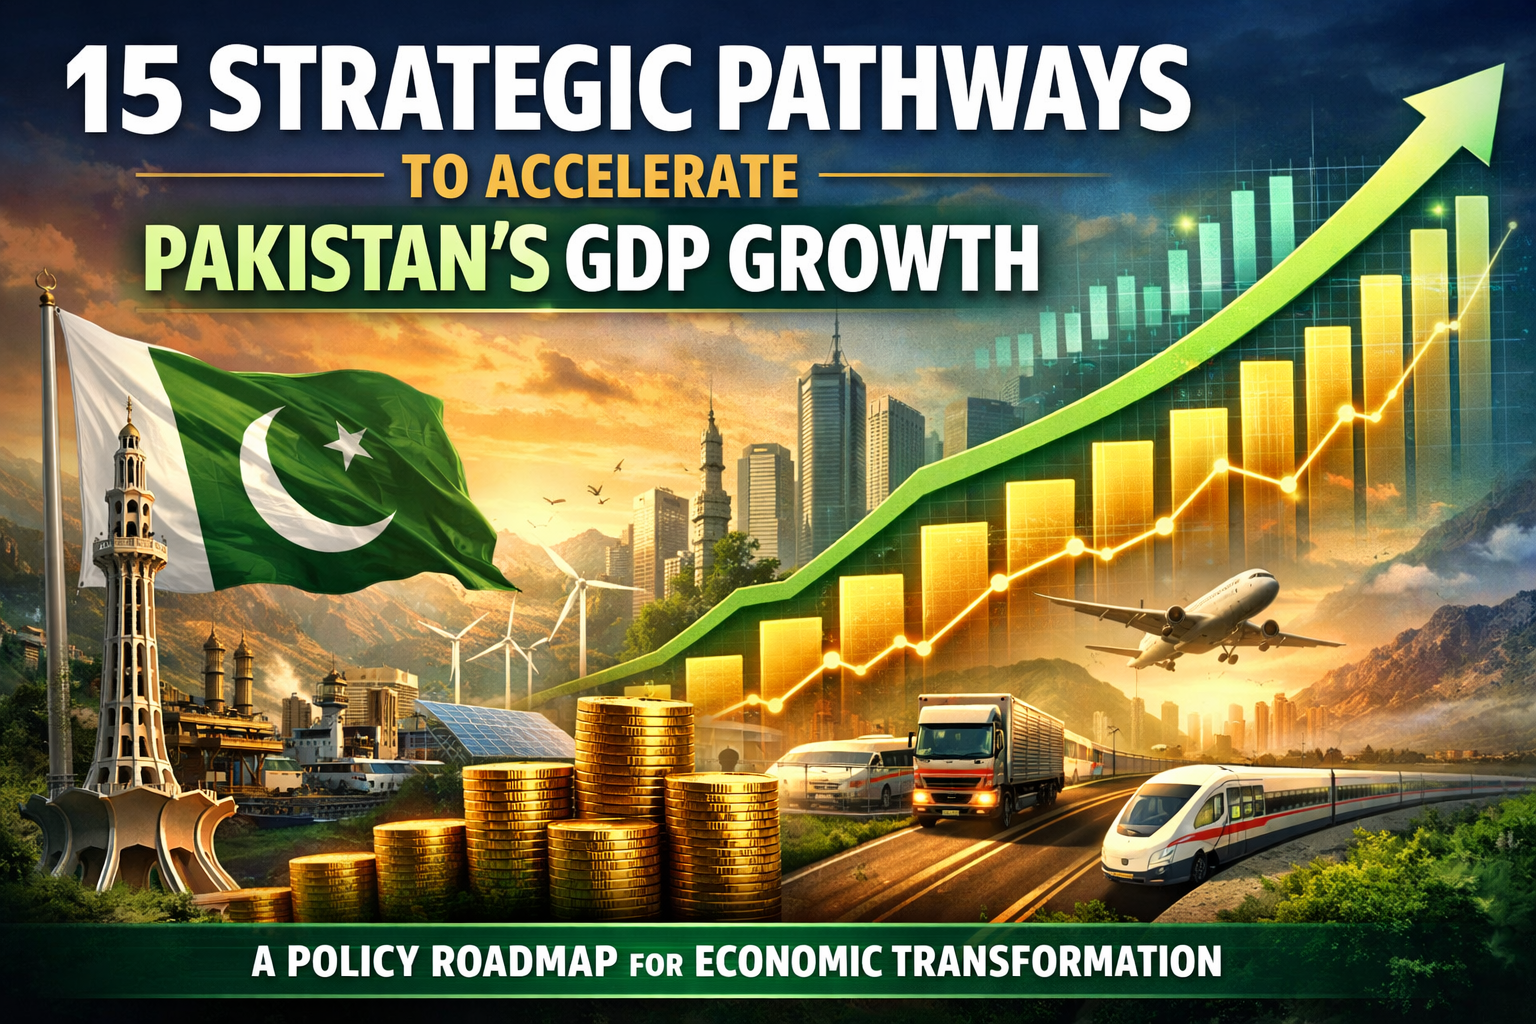
Expert analysis: How Pakistan can accelerate economic growth from 2.7% to 6%+ through strategic reforms in exports, tech, agriculture & more. Data-driven insights.
Pakistan stands at a critical economic crossroads in 2025. With GDP growth projected at just 2.7% according to the IMF—barely half the rate needed to absorb the 2.4 million Pakistanis entering the workforce annually—the nation faces a stark choice between bold structural reform and continued stagnation. Yet beneath these sobering headlines lies extraordinary untapped potential worth over $100 billion in additional GDP by 2030.
Consider this paradox: Pakistan received a record-breaking $38.3 billion in remittances in fiscal year 2024-25, a 27% year-over-year surge that now exceeds total export earnings. Meanwhile, textile exports climbed to $17.8 billion, and foreign direct investment increased 56% in the first seven months of FY25. These are not the indicators of a failing economy—they’re the building blocks of transformation waiting to be assembled into a coherent growth strategy.
The evidence from regional peers is instructive. Vietnam attracted $6.9 billion in FDI in just the first two months of 2025, while Bangladesh—despite recent political turmoil—maintained $30 billion in annual remittances. India secured $71 billion in FDI throughout 2024, with booming semiconductor and fintech sectors. Pakistan possesses similar strategic advantages: a 255-million-strong market, a youthful population with 60% under age 30, and geographic positioning at the nexus of South Asia, Central Asia, and the Middle East.
What separates high-growth emerging markets from stagnant ones isn’t resource endowment or population size—it’s execution. This analysis presents 15 evidence-based pathways, grounded in successful emerging market strategies and Pakistan’s unique competitive advantages, that could accelerate the nation’s trajectory from today’s $374.6 billion economy to a $500 billion powerhouse within the decade.
1. Revolutionize Export Competitiveness Through Value-Addition
Pakistan’s textile sector generated $17.8 billion in FY25, accounting for 55.8% of total exports. Yet the sector operates at just 60% of its $25 billion installed capacity. The solution isn’t producing more cotton yarn—where exports plummeted 34% year-over-year—but moving aggressively into value-added segments.
Data reveals the strategy’s viability: ready-made garments surged 23% in the first five months of FY25, while knitwear climbed 18.4%. Bangladesh, despite political unrest, still commands global apparel markets worth $35 billion annually. Pakistan’s advantage lies in redirected orders from Bangladesh’s struggling factories—over 2,300 registered units have closed in 18 months—and China’s textile tariffs. Leading exporters like Interloop Limited ($147 billion PKR in FY24) and Style Textile ($135 billion PKR) demonstrate the sector’s premium potential.
The pathway forward requires three elements: industrial electricity tariffs below $0.08 per kWh to match Vietnamese competitiveness, accelerated customs clearance reducing the average 12-day port turnaround, and targeted financing for machinery modernization. With consistent energy supply and restored zero-rating on local supplies, Pakistan could realistically achieve $25 billion in textile exports by 2027, adding $7-8 billion annually to GDP.
2. Transform Agriculture into a High-Productivity Export Engine
Agriculture contributes 23.5% to Pakistan’s GDP and employs 37.4% of the workforce, yet productivity lags decades behind global standards. The sector recorded just 0.56% growth in FY25, with major crops contracting 13.5% due to climate shocks and outdated practices. This represents Pakistan’s single largest missed opportunity.
The World Bank estimates that modernizing Pakistani agriculture could unlock $30-40 billion in additional value by 2030. Consider the baseline: per-hectare wheat yields average 2.9 tons compared to India’s 3.4 tons and China’s 5.6 tons. Rice yields similarly trail at 3.2 tons per hectare versus Vietnam’s 5.8 tons. Livestock, which showed 4.7% growth and accounts for 60% of agricultural GDP, remains largely informal and inefficient.
Evidence-based reforms would focus on three priorities. First, precision agriculture adoption—drip irrigation, GPS-guided machinery, and soil health monitoring—could boost yields 25-35% while reducing water consumption by 40%. Second, establishing cold-chain infrastructure spanning farm-to-market networks would reduce the current 30-40% post-harvest losses worth $4 billion annually. Third, creating value-added processing zones for fruits, vegetables, and dairy would triple export revenues from the current $4.5 billion baseline.
China has already signed protocols for Pakistani dried chili, dairy products, and heated beef exports. Leveraging the China-Pakistan Agricultural Cooperation framework with its focus on germplasm resources and processing technology could transform Pakistan from a food importer to a regional agricultural powerhouse.
3. Unleash Digital Economy Growth and IT Export Expansion
Pakistan’s IT exports reached $3.8 billion in FY24-25, marking an 18% year-over-year increase. With over 130 million broadband connections and a rapidly growing freelance economy, the sector represents Pakistan’s fastest pathway to high-value, low-carbon GDP growth. Yet the nation captures less than 1% of the global $1.2 trillion IT services market.
India’s IT sector generates $245 billion annually—nearly 10% of its GDP—demonstrating the scalable potential. Vietnam’s tech sector attracted 68% of its FY25 FDI inflows, showing how digital infrastructure drives broader economic transformation. Pakistan’s English-speaking workforce, competitive labor costs 40-50% below India’s, and expanding fiber-optic networks create a foundation for exponential growth.
The strategy requires coordinated action across four dimensions. First, establishing 50 new technology parks in Tier-2 cities—Faisalabad, Sialkot, Multan—would decentralize opportunities beyond Karachi, Lahore, and Islamabad. Second, reforming data localization requirements and simplifying foreign payment processing would attract multinational R&D centers, as seen with Google and Microsoft’s investments in India’s tier-2 cities. Third, creating a $500 million venture capital co-investment fund would catalyze Pakistan’s struggling startup ecosystem, which saw funding collapse 88% from $355 million in 2022 to just $43 million in 2024. Fourth, training 500,000 developers, data scientists, and AI specialists through public-private partnerships would address the acute talent shortage.
Industry projections suggest these reforms could drive IT exports to $15 billion by 2030, contributing 1.5-2% additional GDP annually while creating 1.5 million high-paying jobs.
4. Attract FDI Through Regulatory Simplification and Investment Zones
Foreign Direct Investment totaled just $2.46 billion in FY25—representing merely 0.6% of GDP—compared to India’s $71 billion (2.2% of GDP), Vietnam’s $35.7 billion (8.1% of GDP), and even Bangladesh’s $3.5 billion (1.1% of GDP). Pakistan’s FDI-to-GDP ratio has consistently underperformed regional peers for two decades, costing the economy an estimated $40-50 billion in lost growth.
The challenge isn’t Pakistan’s investment potential—the country allows 100% foreign ownership across most sectors and offers a $374 billion market. The problem is execution. The World Bank’s Doing Business indicators reveal the bottlenecks: starting a business requires 17 procedures over 16.5 days compared to 7 procedures and 4 days in Singapore. Contract enforcement takes 1,071 days versus Malaysia’s 425 days. Recovering insolvency requires 2.9 years against Vietnam’s 5 years.
Evidence from successful reformers shows the pathway. In 2014, India launched “Make in India” alongside 98 regulatory reforms, attracting $64 billion in FDI within 24 months. Rwanda cut business registration from 14 days to 6 hours, triggering a sustained FDI surge. The UAE’s free zones with zero taxation, 100% repatriation, and fast-track approvals now host 380,000 companies.
Pakistan’s Special Investment Facilitation Council (SIFC) represents a promising start, but implementation remains inconsistent. The strategy should prioritize three initiatives: establishing 10 sector-specific Special Economic Zones with five-year tax holidays, automated customs clearance, and dedicated utility connections; creating single-window digital portals for investment approvals, eliminating the current 35-40 agency touchpoints; and guaranteeing dispute resolution through international arbitration backed by sovereign commitment.
Saudi Arabia’s planned investment in Pakistan’s Reko Diq copper-gold project—potentially $2 billion for 10-20% equity—illustrates the latent interest. Systematic reforms could realistically triple FDI to $7.5 billion annually by 2028, adding 0.8-1% to annual GDP growth.
5. Capitalize on Record Remittances Through Financial Inclusion
Overseas Pakistanis sent $38.3 billion home in FY25, a stunning 27% increase that marks the highest remittance flow in Pakistan’s history. This eclipsed total export earnings of $29.5 billion, making remittances the nation’s largest foreign exchange source. Saudi Arabia contributed $8.2 billion, UAE $6.8 billion, and the UK $6.4 billion, demonstrating the diaspora’s substantial economic power.
Yet Pakistan captures only a fraction of remittances’ growth potential. Studies by the World Bank show that every dollar of remittances spent through formal banking systems multiplies economic impact 2.3-2.8 times through consumption, investment, and credit expansion. Currently, 25-30% of remittance-dependent households lack formal bank accounts, limiting this multiplier effect.
The transformation strategy centers on financial deepening. First, extending the Roshan Digital Account platform—which has attracted $7.4 billion since September 2020—to offer diaspora investors stakes in infrastructure bonds, real estate investment trusts (REITs), and Pakistan Stock Exchange listings would channel remittances into productive investment rather than pure consumption. Second, creating remittance-linked microfinance products allowing recipients to access working capital loans at preferential rates would boost entrepreneurship in rural areas where 65% of remittances flow. Third, reducing transaction costs through fintech competition—Pakistan’s average remittance cost remains 6.1% versus the G20 target of 3%—would increase net inflows by $800 million-$1 billion annually.
Morocco’s experience demonstrates the model: by offering diaspora-specific investment vehicles and streamlined property purchase procedures, the country doubled remittance-funded productive investment from 15% to 30% between 2015-2023. Pakistan could realistically channel 35-40% of the $38 billion into business formation, housing construction, and equity markets, generating $15-20 billion in additional economic activity and 0.5-0.7% annual GDP growth.
6. Modernize Energy Infrastructure to Lower Industrial Costs
Pakistan’s industrial electricity tariffs averaging $0.12-0.14 per kWh rank among the world’s highest, compared to $0.06-0.08 in Vietnam and $0.07-0.09 in Bangladesh. This cost differential alone explains much of Pakistan’s export competitiveness gap. Energy costs represent 25-30% of textile manufacturing expenses, 18-22% in cement production, and 15-20% in chemicals—making competitiveness impossible at current rates.
The energy sector’s contradictions are striking: Pakistan possesses enormous untapped renewable potential—60,000 MW of wind, 100,000 MW of solar, and 3,100 MW of readily exploitable hydropower—yet relies on expensive imported LNG and furnace oil for 40% of generation. The result is unsustainable circular debt exceeding PKR 2.3 trillion ($8.2 billion) and commercial losses that get passed to consumers.
International Monetary Fund analysis suggests that comprehensive energy reform could reduce industrial power costs by 30-35% while eliminating circular debt within three years. The strategy requires four parallel initiatives: accelerating renewable energy adoption through competitive bidding that has already driven solar costs below $0.04 per kWh; renegotiating legacy Independent Power Producer agreements that guarantee 15-17% dollar-denominated returns regardless of generation; privatizing distribution companies to end politically-motivated theft that averages 18% system-wide losses; and completing long-delayed transmission upgrades that bottleneck 4,000-5,000 MW of available generation.
China’s State Grid Corporation has expressed interest in modernizing Pakistan’s transmission infrastructure, while UAE’s TAQA and Saudi Arabia’s ACWA Power could anchor renewable projects. Reducing industrial electricity tariffs to regional averages would restore $8-10 billion in export competitiveness, boost manufacturing GDP by 1.5-2%, and create 400,000-500,000 jobs in export-oriented industries.
7. Optimize Tax Policy for Broadening the Base Without Crushing Growth
Pakistan’s tax-to-GDP ratio of 10.2% ranks among the world’s lowest—less than half of India’s 21.3%, Bangladesh’s 18.7%, or Vietnam’s 19.4%. This chronic revenue deficit constrains public investment in infrastructure, education, and health while forcing unsustainable borrowing. Yet counterintuitively, Pakistan simultaneously imposes some of the highest tax rates on formal businesses: 29% corporate tax, 35% super tax on high earners, and a maze of withholding taxes that effectively push marginal rates above 40%.
The result is a destructive equilibrium: only 3.2 million Pakistanis file income tax returns in a nation of 255 million, while registered taxpayers face punitive rates that discourage formalization. The Finance Act 2025’s harsh enforcement measures—including Section 37A and 37B allowing arrests without prior notice—have triggered capital flight rather than compliance. Simultaneously, IMF assessment reveals that tax exemptions and concessions cost 4.6% of GDP annually, disproportionately benefiting real estate, energy, and connected sectors.
Evidence from successful reformers demonstrates the alternative pathway. Indonesia broadened its tax base from 27 million to 45 million filers between 2016-2023 through voluntary disclosure programs, simplified filing, and lower rates—raising the tax-to-GDP ratio from 10.8% to 13.2%. Rwanda achieved 15.2% tax-to-GDP despite being poorer than Pakistan by eliminating exemptions, digitizing administration, and creating a reputation for fairness.
Pakistan’s optimal strategy balances three priorities: reducing corporate tax rates to 20-22% to match regional competitors while eliminating most exemptions and concessions; expanding the tax net to capture the undocumented real estate, wholesale trade, and services sectors through property transaction monitoring, utility consumption cross-referencing, and digital trail enforcement; and providing three-year tax holidays for new business registrations coupled with aggressive prosecution of major evaders. Combined with simplified filing through a unified portal, these reforms could realistically boost tax collection to 13-14% of GDP within three years—adding PKR 2-2.5 trillion ($7-9 billion) annually for growth-enhancing infrastructure investment.
8. Develop Human Capital Through Education-to-Employment Alignment
Pakistan faces a demographic paradox: 60% of its 255 million people are under age 30—potentially the world’s largest youth dividend—yet 40% of university graduates remain unemployed or underemployed. The disconnect between education and market demands costs the economy an estimated $15-20 billion annually in lost productivity while fueling social frustration.
Current spending patterns explain the crisis. Public education expenditure remains stuck at 2.2% of GDP versus the UNESCO-recommended 4-6% and regional comparators like India (4.6%), Vietnam (4.1%), and Bangladesh (2.9%). This translates to minimal per-student investment: Pakistan spends $180 per primary student compared to India’s $521 and Vietnam’s $611. Unsurprisingly, learning outcomes lag dramatically—only 38% of Grade 5 students demonstrate basic reading proficiency according to the World Bank.
Beyond funding, curriculum misalignment creates structural unemployment. Engineering graduates learn theoretical concepts divorced from industry practice. Business schools produce MBAs who’ve never analyzed real financial statements. Computer science majors graduate without knowledge of modern development frameworks. Meanwhile, employers desperately seek skilled workers: the textile sector needs 80,000 trained technicians, IT companies struggle to fill 120,000 positions, and construction projects face chronic shortages of qualified supervisors.
The solution requires wholesale reform across three dimensions. First, expanding technical and vocational education through German-style apprenticeship programs combining classroom instruction with paid workplace training. Germany’s model produces employment rates above 90% for vocational graduates. Second, mandating industry advisory boards for all university programs, ensuring curriculum matches market needs. Third, creating 200 sector-specific training centers—Advanced Manufacturing Institute, Digital Skills Academy, Agricultural Extension Centers—operated through public-private partnerships modeled on Singapore’s SkillsFuture program.
Investment would be substantial: $3-4 billion annually, or 0.8-1.0% of GDP. But returns would far exceed costs: trained workers earn 40-60% higher wages, boosting consumption and tax revenue, while reduced skill mismatches could add 0.7-0.9% to annual GDP growth.
9. Unlock Manufacturing Growth Through SME Access to Finance
Small and medium enterprises constitute 90% of Pakistani businesses and employ 78% of the non-agricultural workforce, yet receive less than 7% of total banking credit. This credit starvation constrains the economy’s most dynamic sector, limiting job creation and innovation. Meanwhile, banks park excess liquidity in risk-free government securities yielding 12-15% rather than extending business loans.
The contrast with successful Asian economies is stark. In Vietnam, SMEs access 28% of total credit; in Thailand 32%; in South Korea 38%. These nations achieved inclusive growth by systematically reducing SME financing barriers through credit guarantee schemes, alternative lending platforms, and regulatory incentives for bank lending.
Pakistan’s SME credit gap is estimated at $50-70 billion—nearly equivalent to 15-20% of GDP. This financing deficit prevents promising manufacturers from upgrading machinery, prevents service providers from expanding, and prevents retailers from opening new locations. The result is artificially suppressed economic activity across every sector.
The breakthrough strategy would deploy five complementary mechanisms. First, establishing a $10 billion National SME Credit Guarantee Corporation that assumes 50-70% of default risk, mirroring successful programs in Japan and South Korea that catalyzed 4-6x leverage in private lending. Second, licensing 20-30 specialized SME banks focused exclusively on businesses with annual revenues between PKR 50 million-800 million, similar to India’s Small Industries Development Bank. Third, creating alternative credit assessment frameworks based on transaction history, utility payments, and supply chain relationships rather than traditional collateral requirements that exclude 80% of SMEs. Fourth, digitizing the entire loan application and approval process through blockchain-verified documentation, reducing approval time from 120-180 days to 7-10 days. Fifth, mandating that commercial banks dedicate 18-20% of their lending portfolio to SMEs within three years, enforced through differentiated reserve requirements.
International experience suggests these reforms could increase SME lending from $15 billion currently to $45-50 billion within five years. With average loan-to-value ratios of 60-70%, this would unlock $70-80 billion in SME investment, generating 2-2.5 million jobs and adding 1.2-1.5% to annual GDP growth through enhanced productivity and expanded production.
10. Leverage CPEC and Regional Connectivity for Trade Expansion
The China-Pakistan Economic Corridor represents Pakistan’s most significant infrastructure investment—$62 billion committed across energy, transport, and special economic zones. Yet seven years after CPEC’s 2017 peak, the returns remain disappointing. Only 9 of 27 planned Special Economic Zones are operational, Chinese FDI has declined to $568 million in FY24 from peak levels, and trade volumes have failed to meet projections.
The challenge extends beyond CPEC. Pakistan’s trade with Central Asian republics—Kazakhstan, Uzbekistan, Turkmenistan, Kyrgyzstan, Tajikistan—totals barely $900 million despite a combined market of 75 million people and $320 billion GDP. Iran, sharing an 800-kilometer border, records just $2.1 billion in bilateral trade. Afghanistan, despite Pakistani transit trade access, generates controversial and often disrupted commerce.
This represents a colossal missed opportunity. Pakistan’s geography positions it as the natural bridge linking China’s western regions, Central Asia’s energy and mineral wealth, and South Asia’s consumer markets. The Gwadar Port, once operational at capacity, could handle 300-400 million tons annually—10x current volumes. The Karakoram Highway and upgraded rail connections could carry $20-30 billion in annual transit trade.
Unlocking this potential requires strategic recalibration across four priorities. First, completing “early harvest” CPEC projects—particularly the 1,872 km ML-1 railway upgrade connecting Karachi to Peshawar at $6.8 billion cost—that would reduce freight time from 18 hours to 8 hours while boosting capacity from 34 to 137 trains daily. Second, operationalizing Gwadar Port through aggressive marketing to Chinese, Central Asian, and Afghan shippers, offering competitive handling rates 15-20% below Karachi while guaranteeing smooth customs clearance. Third, negotiating bilateral Free Trade Agreements with Uzbekistan and Kazakhstan, focusing on textiles-for-energy exchanges and agricultural product access. Fourth, establishing the long-discussed Pakistan-Afghanistan-Uzbekistan railway corridor that would slash Central Asian shipping costs by 40-50% compared to current Iran-Turkey routes.
Turkey’s strategic positioning between Europe and Asia provides the template: it evolved from peripheral economy to global logistics hub, capturing $25-30 billion in annual transit revenue. Pakistan could realistically generate $10-15 billion in transit fees, logistics services, and warehousing revenues by 2030 while boosting manufactured exports through Central Asian market access. Combined impact: 0.6-0.8% additional annual GDP growth plus 300,000-400,000 jobs in logistics, warehousing, and trade services.
11. Accelerate Digital Financial Services and Fintech Innovation
Pakistan’s financial inclusion rate stands at 21% according to the World Bank, meaning 79% of adults—nearly 120 million people—lack formal banking access. This financial exclusion constrains consumption, prevents savings accumulation, blocks entrepreneurship, and forces reliance on informal moneylenders charging 30-60% annual interest. Yet Pakistan simultaneously hosts 130 million mobile phone users and 100 million smartphone connections—the infrastructure for fintech revolution exists.
India’s digital payments transformation offers the clearest roadmap: the Unified Payments Interface (UPI) processed 15.2 billion transactions worth $350 billion in 2024, up from essentially zero in 2016. This digital leap included 400 million previously unbanked citizens, catalyzed 150 million nano-entrepreneurs, and added an estimated 1.2% to annual GDP growth. Kenya’s M-Pesa mobile money platform similarly revolutionized financial access, lifting 194,000 households—2% of Kenyan households—out of poverty according to MIT research.
Pakistan’s digital payment volume totaled just $42 billion in FY24, representing 11% of GDP compared to India’s 68% and Kenya’s 47%. The potential for expansion is extraordinary: capturing just 25% of Pakistan’s cash economy—estimated at 60-70% of all transactions—would inject $90-100 billion into formal channels, expanding the tax base, enabling credit scoring, and facilitating e-commerce.
The acceleration strategy requires five synchronized reforms. First, mandating open banking standards allowing third-party developers to build payment applications on bank infrastructure, mirroring the UK’s revolutionary approach that spawned 400 fintech companies. Second, licensing 50 specialized Electronic Money Institutions (EMIs) to offer mobile wallets, peer-to-peer transfers, and merchant payments without full banking infrastructure requirements. Third, establishing a national digital identity system linked to biometric verification that eliminates the cumbersome documentation currently blocking account opening. Fourth, creating regulatory sandboxes where fintech startups can test innovative products—microloans based on mobile usage, agricultural insurance using satellite data, gold-backed savings accounts—without bureaucratic approval delays. Fifth, requiring all government payments including salaries, pensions, and procurement to flow exclusively through digital channels, forcing adoption among the 4 million government employees and millions of vendor relationships.
International consultancies estimate these reforms could boost financial inclusion to 65-70% within four years while generating $8-10 billion in annual fintech transaction revenue. The multiplier effects—enhanced tax collection, expanded credit, reduced corruption, accelerated e-commerce—could add 0.5-0.7% to annual GDP growth while creating 150,000-200,000 fintech-enabled jobs.
12. Develop Tourism as a High-Growth Foreign Exchange Source
Pakistan welcomed merely 1.8 million international tourists in 2024, generating approximately $800 million in foreign exchange earnings. This compares catastrophically to Vietnam’s 12.6 million visitors ($35 billion revenue), Egypt’s 14.9 million ($13 billion), and Turkey’s 51.4 million visitors ($51 billion). Yet Pakistan possesses tourism assets arguably superior to these comparators: five UNESCO World Heritage Sites, the world’s second-highest peak K2, pristine beaches spanning 1,046 kilometers, the ancient Indus Valley Civilization ruins, and the spectacular Karakoram Highway rated among the world’s greatest road journeys.
Security concerns and international perceptions explain much of the tourism deficit, but internal constraints matter equally. Pakistan offers just 85,000 quality hotel rooms compared to Vietnam’s 550,000 and Turkey’s 1.2 million. Tourist visa processes remain cumbersome despite the 2019 e-visa system introduction. Domestic connectivity is poor—reaching northern tourism destinations requires 12-18 hours by road from major cities. Marketing budgets trail regional peers by 90-95%.
The World Travel and Tourism Council estimates Pakistan’s tourism potential at $18-22 billion annually by 2030—representing 25-28x current levels—based on infrastructure investment and perception management. This would generate 2.5-3.0 million direct jobs while stimulating construction, hospitality, transport, and handicrafts sectors.
The roadmap requires investment across six pillars. First, launching a $500 million “Brand Pakistan” global marketing campaign highlighting safety improvements, natural beauty, and cultural heritage, modeled on Turkey’s “Home of Peace” rebrand that reversed tourism declines post-2016. Second, fast-tracking 150 tourism infrastructure projects including mountain resorts in Hunza and Skardu, coastal developments in Gwadar and Karachi, and heritage tourism circuits connecting Mohenjo-daro, Harappa, Taxila, and Lahore. Third, training 100,000 hospitality workers through specialized tourism academies and language programs. Fourth, simplifying visa processing to 24-hour e-visa issuance for citizens of 100+ countries, matching Thailand’s streamlined approach. Fifth, developing domestic aviation infrastructure with 15 new small airports connecting tourism destinations directly to major cities, reducing travel time by 60-70%. Sixth, creating safety certifications and tourist police units that guarantee visitor security.
Turkey’s experience—growing tourism from 31 million visitors ($25 billion) in 2011 to 51 million ($51 billion) in 2024 despite security challenges—proves the model works. Pakistan could realistically attract 8-10 million tourists by 2030, generating $8-10 billion in revenue and contributing 0.4-0.5% to annual GDP growth.
13. Strengthen Institutional Governance and Anti-Corruption Frameworks
The IMF’s 2025 Governance and Corruption Diagnostic Assessment delivered a devastating verdict: Pakistan loses 5-6.5% of GDP annually—approximately $20-25 billion—to corruption driven by entrenched “elite capture.” This systemic leakage equals the nation’s entire education and health budgets combined. Procurement costs run 25-30% above international norms. Infrastructure projects face 40-50% budget overruns, mostly from corrupt practices. Tax exemptions worth 4.6% of GDP flow to politically connected sectors.
The human cost extends beyond numbers. Investors consistently rank corruption as Pakistan’s top business obstacle—above security concerns and infrastructure deficits. The World Bank’s 2024 Ease of Doing Business indicators placed Pakistan 108th of 190 nations, with contract enforcement and property registration particularly problematic. Transparency International scores Pakistan 133rd of 180 nations on its Corruption Perceptions Index.
Yet countries have escaped corruption traps through sustained institutional reform. Rwanda, post-genocide, overhauled governance systems and achieved 49th place globally—ahead of several European nations. Singapore, once corruption-ridden, implemented draconian enforcement that transformed it into the world’s second-least-corrupt country. Georgia reduced corruption dramatically between 2003-2012 through police restructuring, civil service reform, and digital government services that eliminated human discretion.
Pakistan’s optimal strategy combines six components. First, establishing genuinely autonomous anti-corruption courts modeled on Hong Kong’s Independent Commission Against Corruption (ICAC), with special prosecutors, judges shielded from political pressure, and fast-track proceedings guaranteeing verdicts within 6-9 months rather than the current 8-12 years. Second, digitizing all government services—business registration, tax filing, permit issuance, land records—through citizen-facing portals that eliminate discretionary official interaction, mirroring Estonia’s e-governance model where 99% of public services operate online. Third, implementing transparent procurement systems with competitive bidding, public contract disclosure, and third-party audits for all projects exceeding PKR 100 million. Fourth, protecting whistleblowers through anonymity guarantees, financial rewards (10-15% of recovered funds), and relocation assistance when needed. Fifth, prosecuting high-profile cases demonstrating that elite impunity has ended—Singapore’s founding leader Lee Kuan Yew famously imprisoned his own minister for corruption. Sixth, professionalizing the civil service through merit-based recruitment, performance incentives, and competitive compensation that reduces temptation.
The World Bank estimates that reducing corruption by 50% could boost GDP growth by 1.5-2.0% annually through enhanced investment, improved infrastructure delivery, and strengthened institutions. For Pakistan, this translates to $6-8 billion additional annual GDP by 2030—matching the total received from IMF programs but generated sustainably through better governance.
14. Pursue Climate Resilience and Green Growth Opportunities
The catastrophic 2022 floods that submerged one-third of Pakistan, displaced 33 million people, and caused $30 billion in damages—43% in agriculture alone—exposed the nation’s acute climate vulnerability. Yet climate change represents not just existential threat but economic opportunity: the global green economy is projected to reach $10.3 trillion by 2030, and Pakistan’s strategic positioning enables capturing substantial market share.
Pakistan ranks among the world’s top 10 most climate-vulnerable nations according to the Climate Risk Index, facing glacial melt threatening water security for 240 million people, rising temperatures reducing crop yields by 10-15% over recent decades, intensifying monsoons causing more frequent catastrophic flooding, and desertification affecting 1.6 million hectares. These climate stresses will cost an estimated 3-5% of GDP annually by 2030 without adaptation measures.
Simultaneously, green economy opportunities are immense. Pakistan’s renewable energy potential—60,000 MW wind, 100,000 MW solar, 3,100 MW small hydro—could position it as a clean energy exporter to South and Central Asia. Carbon credit markets, where Pakistan holds 500-700 million tons of sequestration potential through reforestation, could generate $5-10 billion if properly developed. Green hydrogen production using cheap solar electricity could supply hard-to-decarbonize sectors including shipping and chemicals.
The transformation requires integrated climate-economy strategy across five priorities. First, investing $4-6 billion annually in climate adaptation infrastructure including flood management systems, drought-resistant agricultural practices, early warning networks, and resilient housing—expenses that pay for themselves by preventing disaster losses. Second, channeling 50% of CPEC Phase II investments toward renewable energy projects, expanding solar and wind capacity from current 3,500 MW to 25,000 MW by 2030 and replacing expensive imported fossil fuels. Third, launching the 10 Billion Tree Tsunami program to restore degraded forests, create carbon sequestration certificates tradable on international markets, and boost ecotourism. Fourth, developing green manufacturing zones focused on electric vehicle assembly, solar panel production, and battery manufacturing that supply both domestic markets and regional exports. Fifth, accessing the $20 billion World Bank Country Partnership Framework emphasizing clean energy and climate resilience projects announced in 2025.
International experience shows that climate-smart growth isn’t contradictory—Denmark derives 50% of electricity from wind while maintaining high income levels; Costa Rica achieved 98% renewable electricity and tourism-driven prosperity. For Pakistan, integrated climate action could add 0.4-0.6% to annual GDP growth through renewable energy savings, green exports, and avoided disaster costs while creating 400,000-500,000 green economy jobs.
15. Deepen Capital Market Development and Corporate Governance
The Pakistan Stock Exchange (PSX) closed 2024 as one of the world’s best-performing markets, with the KSE-100 index surging 85% to reach 115,000 points. Yet despite this spectacular run, market capitalization remains just $108 billion—representing 29% of GDP compared to India’s 120%, Indonesia’s 42%, and Bangladesh’s 38%. Only 534 companies list on PSX versus 5,400 on India’s NSE, 850 on Indonesia’s IDX, and 380 on Vietnam’s HOSE.
This underdevelopment reflects deeper structural issues. Foreign institutional investment constitutes merely 4-6% of PSX market cap compared to 23% in India and 18% in Indonesia. Corporate bond markets are virtually nonexistent—$3.8 billion outstanding versus India’s $320 billion and Indonesia’s $195 billion. Pension fund assets equal just 2.1% of GDP against India’s 15% and Malaysia’s 68%. Retail equity participation captures only 0.5% of the population—1.2 million investors in a nation of 255 million.
This capital market shallowness constrains growth by forcing excessive dependence on bank financing, preventing companies from raising long-term investment capital, offering limited retirement savings vehicles, and denying households wealth-building opportunities. It also blocks foreign portfolio investment that could provide $8-12 billion annually.
The deepening strategy requires comprehensive capital market reforms across six dimensions. First, incentivizing IPOs through five-year tax holidays for newly listed companies with minimum $50 million market cap, mirroring Vietnam’s successful approach that drove 100+ IPOs between 2018-2023. Second, strengthening corporate governance through mandatory independent directors (40% of boards), quarterly earnings disclosure, and severe penalties for financial fraud that restore investor confidence. Third, developing fixed-income markets by requiring government-owned enterprises to issue corporate bonds, establishing credit rating agencies, and creating bond ETFs accessible to retail investors. Fourth, expanding pension coverage from 6 million workers currently to 25 million through auto-enrollment workplace savings plans invested 60% in equities, following Chile’s privatized pension model. Fifth, allowing Real Estate Investment Trusts (REITs) for commercial property with pass-through taxation, unlocking Pakistan’s $400-500 billion real estate sector for middle-class investment. Sixth, streamlining foreign investment procedures through single-day registration, guaranteed repatriation, and treaty protections that match regional standards.
The World Bank estimates that doubling capital market depth to 60% of GDP could boost annual growth by 0.8-1.2% through enhanced corporate investment, efficient capital allocation, and expanded household wealth. For Pakistan, this would mean PSX market capitalization reaching $220-240 billion by 2030, corporate bond markets expanding to $40-50 billion, and 8-10 million retail investors—generating an additional $8-10 billion in annual economic activity.
The Path Forward: From Analysis to Implementation
Pakistan’s economic stagnation is neither inevitable nor permanent. Each of the 15 pathways outlined above is grounded in evidence from successful emerging markets and Pakistan’s demonstrated capabilities. Collectively, these reforms could realistically accelerate GDP growth from the current 2.7% to 5.5-6.5% within five years—a doubling that would fundamentally transform living standards, employment, and national confidence.
The arithmetic is compelling. Export competitiveness gains could add $12-15 billion annually. Agricultural modernization could unlock $8-10 billion. IT sector scaling could contribute $8-12 billion. FDI tripling would inject $4-5 billion yearly. Remittance optimization could generate $6-8 billion in multiplier effects. Energy reform would save $8-10 billion. Tax broadening would mobilize $7-9 billion for infrastructure. SME financing would create $15-18 billion in new business activity. Regional connectivity could generate $10-15 billion. Fintech expansion would formalize $20-25 billion. Tourism development could earn $8-10 billion. Governance improvements would recover $10-12 billion annually. Climate-smart growth could contribute $4-6 billion while avoiding disaster losses. Capital market deepening would mobilize $8-10 billion.
The combined potential exceeds $150 billion in additional annual GDP by 2030—transforming Pakistan from a $375 billion economy to $500-550 billion, raising per capita income from $1,680 to $2,150-2,350, and creating 8-10 million quality jobs for the bulging youth population.
Yet implementation represents the genuine challenge. Pakistan has produced countless reform blueprints—Vision 2010, Vision 2025, countless IMF programs—that foundered on elite resistance, bureaucratic inertia, and political instability. What distinguishes successful reformers like Vietnam, Rwanda, or Indonesia isn’t better strategies but sustained execution across electoral cycles backed by political leadership willing to confront vested interests.
Three factors could make this time different. First, the emerging geopolitical environment offers unprecedented opportunities—Saudi Arabia’s $25 billion investment interest, UAE’s expansion plans, China’s CPEC recalibration, and Western desire for supply chain diversification away from China. Second, the dire fiscal situation creates reform urgency—Pakistan cannot sustain current debt servicing consuming 50% of revenues while running persistent current account deficits. Third, digital technology enables reform implementation in ways impossible two decades ago—Estonia built world-leading e-governance, India revolutionized payments through UPI, Rwanda digitized land records to end corruption.
The window of opportunity is closing. Pakistan’s youth bulge—potentially the world’s largest productive workforce by 2030—will either drive unprecedented prosperity or fuel social instability if economic inclusion fails. Regional competitors aren’t standing still: Bangladesh seeks $30 billion annual garment exports despite current challenges, Vietnam pursues $50-60 billion FDI annually, India positions itself as a semiconductor and pharmaceutical manufacturing hub.
Pakistan’s choice is stark: embrace bold, evidence-based reforms that unlock the nation’s extraordinary potential, or settle for continued stagnation punctuated by repeated IMF bailouts. The pathways outlined above represent not wishful thinking but proven strategies adapted to Pakistani realities. Implementation requires political courage, institutional persistence, and societal commitment to meritocracy over patronage.
The question isn’t whether Pakistan can achieve 6-7% sustained GDP growth—the data says unambiguously it can. The question is whether Pakistan’s leaders and citizens will summon the collective will to make it happen. The $500 billion economy, 10 million new jobs, and doubled living standards await—but only if Pakistan acts decisively, starting now


On September 2, 2026, the UN Environment Programme published a report that treated something once framed as a worst-case risk as a settled outcome: the world will pass 1.5°C of warming. “Limiting Overshoot: Navigating Exceedance of 1.5°C and Pathways Towards Return” marks a deliberate shift in framing, from preventing a threshold breach to managing one already underway — with direct, quantified consequences for climate finance, carbon-removal markets, and the economics of adaptation that businesses and investors now need to plan around.
Key Takeaways
- UNEP’s September 2, 2026 report puts best-case peak warming at 1.8°C even under the most optimistic current government pledges, with a median of around 2.6°C by 2100 (range 1.9°C–3.6°C) under current policies — treating overshoot of the Paris Agreement’s 1.5°C goal as effectively locked in.
- The remaining global carbon budget for a 50% probability of staying within 1.5°C is roughly 130 gigatonnes of CO2 as of 2026 — at current annual emissions of nearly 40 GtCO2, this budget could be exhausted within approximately three years.
- Global disaster losses, including broader economic and ecological damage, already exceed $2.3 trillion annually, according to the UN’s 2026 climate report, while international climate finance reached just $136.7 billion in 2024 — a gap of well over an order of magnitude between damage and financing.
- Carbon dioxide removal (CDR) at the scale needed to return to 1.5°C will cost trillions of dollars, with per-tonne costs estimated at over $100 and ranging up to $1,000 or more depending on the removal method, according to the State of Carbon Dioxide Removal’s Third Edition (2026).
- The Fund for Responding to Loss and Damage held pledges of only around $800 million as of late 2025, a figure researchers describe as dramatically short of documented developing-country needs — underscoring the financing gap at the center of overshoot economics.
From Prevention to Management: A Deliberate Reframing
UNEP’s own annual Emissions Gap Report has tracked the shortfall between climate pledges and required pathways since 2010, but the September 2026 “Limiting Overshoot” report represents a structural change in framing rather than a change in the underlying science. Rather than treating a breach of 1.5°C as an endpoint or failure state, the report proposes an “overshoot, peak, and decline” framework: limiting the maximum level of warming reached, then working to enable a gradual return toward safer conditions over subsequent decades. As UN Secretary-General António Guterres put it in comments accompanying the report’s launch, humanity must pursue “an overshoot of ambition” — accelerating fossil fuel phaseout, slashing methane pollution, and protecting land, forests, and oceans simultaneously, rather than sequencing mitigation and adaptation as separate phases.
The report’s own numbers make clear why this reframing was considered necessary: even the most optimistic scenario incorporating all current government pledges puts expected peak warming at 1.8°C, while continuation of current policies (without stronger pledges) produces a median projection of roughly 2.6°C by century’s end, with a plausible range extending to 3.6°C. Human-induced warming is already approaching 1.4°C and increasing at roughly 0.25°C per decade — a trajectory that leaves essentially no realistic path to avoiding at least a temporary breach of the 1.5°C threshold.
The Carbon Budget Arithmetic
The remaining global carbon budget for a 50% probability of holding warming within 1.5°C stands at roughly 130 gigatonnes of CO2 as of 2026. Against current annual global emissions of nearly 40 gigatonnes, this budget could be exhausted within approximately three years at present emissions rates — a timeline that explains why the report treats exceedance as the base case for planning purposes rather than a tail risk. This arithmetic is central to why the report’s “overshoot, peak, and decline” framework requires not merely emissions reduction but active carbon dioxide removal (CDR) at scale to eventually bring atmospheric concentrations back down, rather than emissions reduction alone.
Tipping Point Risk: The Non-Linear Cost of Overshoot Duration
The UNEP report identifies four specific tipping elements where sustained warming above 1.5°C raises materially elevated risk: the West Antarctic Ice Sheet, the Greenland Ice Sheet, the Atlantic Meridional Overturning Circulation (AMOC), and the climate-biosphere system of the Amazon rainforest. Notably, the report deliberately declines to attach specific temperature thresholds to these tipping points, instead emphasizing that risk increases with both the degree and — critically for economic planning — the duration of overshoot. This duration-sensitivity is central to the report’s economic logic: the longer warming remains above 1.5°C, the greater the cumulative risk of triggering one or more of these systems, with some — such as AMOC weakening — showing model-projected recovery only on a timescale of centuries even if peak warming is later reduced.
This non-linearity matters directly for climate finance and insurance-sector risk modeling: a framework that treats overshoot duration, not just peak magnitude, as the key risk variable implies that near-term emissions reduction and carbon removal investment carry outsized value in limiting tail risk, even if 1.5°C itself is no longer avoidable as a peak.
The Financing Gap: Quantifying the Shortfall
The UN’s broader 2026 climate reporting places global disaster losses — including direct economic damage and broader ecological costs — at over $2.3 trillion annually. Against this figure, international climate finance flows reached just $136.7 billion in 2024, a gap exceeding an order of magnitude between documented damage and available financing. Climate officials have consistently framed this financing not as charitable transfer but as a protective investment against larger future losses — arguing that extreme weather, disrupted agriculture, damaged infrastructure, and displaced populations carry costs to the global economy that substantially exceed the cost of preventive action.
The financing gap is starkest in the Loss and Damage architecture specifically: the Fund for Responding to Loss and Damage held pledges of only around $800 million as of late 2025, against developing-country needs that researchers have estimated run dramatically higher — a mismatch the UNEP report explicitly identifies as an area requiring strengthened international financial commitment, particularly given the report’s emphasis on Common but Differentiated Responsibilities and Respective Capabilities (CBDR-RC) as a governing principle for how overshoot’s costs should be distributed.
The Economics of Carbon Dioxide Removal
Because the “overshoot, peak, and decline” pathway requires active carbon removal to eventually bring warming back toward 1.5°C, CDR economics have become directly material to climate finance planning in a way they were not when 1.5°C avoidance still seemed achievable through emissions reduction alone. The State of Carbon Dioxide Removal’s Third Edition (2026) estimates that many CDR approaches cost over $100 per tonne of CO2 removed, with some methods running $1,000 or more — and that deploying CDR at the annual billion-tonne scale required to meaningfully support a return to 1.5°C will cost trillions of dollars in cumulative terms, posing a genuine financial constraint on the pathway’s feasibility.
UNEP’s 2026 analysis separately and explicitly rules out solar radiation management (SRM) as a viable substitute or complement at this stage, characterizing the evidence base as limited, largely theoretical, and concentrated in a handful of countries — with significant equity implications given that SRM deployment location could produce regionally uneven climate impacts. This effectively narrows the overshoot-management toolkit to emissions reduction plus CDR, reinforcing the trillion-dollar-scale financing requirement rather than offering a lower-cost technological alternative.
Heat, Labor, and Productivity: An Underpriced Economic Risk
Beyond direct disaster losses, the UNEP report highlights heat-related productivity losses as a specific and growing economic risk channel: increasing humid heat is projected to significantly reduce outdoor labor capacity, deepening economic losses specifically in vulnerable, often lower-income countries with large outdoor and agricultural workforces. This risk channel — distinct from more visible disaster-loss categories like flooding or storm damage — represents a slower-moving but potentially larger cumulative economic cost that current climate finance flows are not clearly calibrated to address.
Implications for ESG Finance and Corporate Climate Strategy
- Adaptation finance requires a step-change, not incremental growth. The UN Secretary-General has specifically called on developed countries to triple adaptation finance and ensure it reaches those most at risk — a target that implies current adaptation financing trajectories are viewed as fundamentally inadequate given the now-explicit overshoot scenario.
- CDR investment carries genuine but expensive strategic value. With per-tonne CDR costs ranging from roughly $100 to over $1,000, ESG and climate-focused investors should differentiate between lower-cost, more scalable removal methods and premium, higher-certainty approaches when evaluating portfolio exposure to carbon removal markets.
- Loss and Damage exposure should be modeled as a growing, underfunded liability. With pledged funding around $800 million against dramatically larger documented needs, businesses operating in climate-vulnerable regions should anticipate continued political and financial pressure for expanded corporate and national contributions to this specific financing mechanism.
- Duration-sensitive tipping point risk argues for front-loaded mitigation investment. Because the UNEP framework treats overshoot duration — not just peak temperature — as the key driver of tipping-point risk, near-term mitigation spending carries a risk-reduction value that a pure peak-temperature framing would understate.
Frequently Asked Questions
Has the world already passed the 1.5°C climate threshold?
UNEP’s September 2026 report treats a temporary breach of 1.5°C as effectively locked in given current emissions trajectories, with best-case peak warming projected at 1.8°C even under optimistic government pledges, and the remaining carbon budget for a 50% chance of avoiding breach possibly exhausted within about three years.
How big is the gap between climate damage and climate finance?
Substantial — global disaster losses exceed $2.3 trillion annually according to UN 2026 reporting, while international climate finance reached only $136.7 billion in 2024, an order-of-magnitude gap between documented damage and available financing.
How much will it cost to bring warming back down to 1.5°C after overshoot?
Carbon dioxide removal at the scale needed will cost trillions of dollars cumulatively, with per-tonne costs ranging from roughly $100 to $1,000 or more depending on the removal method, according to the State of Carbon Dioxide Removal’s Third Edition (2026).
Conclusion
The UNEP’s September 2026 “Limiting Overshoot” report represents a genuine inflection point in climate policy framing — an acknowledgment that 1.5°C avoidance is no longer the operative planning assumption, replaced by a more complex “overshoot, peak, and decline” pathway with its own distinct, quantifiable economics. For climate finance, ESG investment strategy, and corporate risk planning, the practical implications are concrete: a financing gap measured in trillions rather than billions, a carbon removal market that must scale to unprecedented size at meaningful cost, and a tipping-point risk profile where the duration of overshoot — not merely its peak — will determine how much of this economic cost becomes irreversible.

The Pentagon rarely uses the word “unrecoverable” in an official acquisition report. It used it this August, in a Selected Acquisition Report describing the state of Boeing’s F-15EX Eagle II program — and the phrase should have every defense-sector supply chain manager, procurement officer, and B2B logistics executive paying close attention.
The core problem: a 102-day strike at Boeing’s St. Louis-area production facilities didn’t just cost the company three months of output. It broke a delivery schedule in a way the Pentagon itself now says can’t be fully undone.
The Aircraft: What the F-15EX Actually Delivers
Before the supply chain story, it’s worth understanding why the Air Force wants this jet badly enough to be publicly frustrated about delays.
The F-15EX Eagle II is the most advanced variant of the F-15 lineage ever built:
- Digital fly-by-wire flight controls and a large-area glass cockpit with touchscreen interface
- A new APG-82 AESA radar, Joint Helmet Mounted Cueing System, and EPAWSS self-defense electronic warfare suite
- Higher speed and longer range than legacy F-15 variants, with a 29,000-lb payload capacity across additional weapons stations versus older Eagles
- A per-unit flyaway cost of roughly $90–93 million, with a 30-year, 104-jet program lifecycle cost estimated at $30–35 billion — a figure that compares favorably to stealth alternatives on a pure cost basis
The Air Force has committed to replacing aging F-15C/D fleets — including 36 jets slated to permanently replace 48 legacy Eagles at Kadena Air Base, Okinawa — with the EX variant, making this as much an Indo-Pacific readiness story as a domestic manufacturing one.
The Strike: 102 Days That Broke a Production Curve
Roughly 3,000+ Boeing machinists in the St. Louis region — spanning facilities in St. Louis, St. Charles, and Mascoutah, Illinois — walked off the job on August 4, 2025. The strike didn’t end until November 13–17, 2025, a complete production halt of more than three months.
Before the walkout, Boeing’s plan was aggressive but achievable:
- Deliver a full dozen Lot 2 Eagle IIs by the end of calendar 2025
- Ramp to an assembly rate of two jets per month by early 2026
- Maintain the program’s prior track record of staying within cost, schedule, and performance baselines — with all Lot 1 aircraft already delivered on time
The strike erased that runway entirely. Then–Air Force chief of staff nominee Gen. Kenneth Wilsbach confirmed the delay in written Senate testimony well before the strike even ended, warning lawmakers that overseas deliveries — including to Kadena — would be pushed into 2026.
Why the Pentagon Called the Slip “Unrecoverable”
Here’s the detail that separates this piece from standard defense-news coverage: the August 2026 Selected Acquisition Report doesn’t just describe a delay — it describes a structural, non-recoverable schedule slip.
- Boeing’s original contract required all 12 Lot 3 jets delivered in early calendar 2026.
- Instead, only about six will arrive by year’s end.
- The report explicitly frames this shortfall as permanent — the missed units are not simply “coming later,” they represent lost production capacity the line cannot make up under current constraints.
The Real Bottleneck: Parts Shortages Compounding the Strike
This is the angle that pure aviation-hobbyist coverage tends to skip, but that matters enormously to defense-sector procurement and supply chain software buyers: the strike exposed — and worsened — a parts shortage that predates it.
- Elbit-built large-area displays and low-profile head-up displays, which give the Eagle II its signature glass cockpit, are running short.
- General Electric F110 engines, the powerplant behind the jet’s performance envelope, face their own allocation constraints.
- Collins-made ejection seat cartridges round out the list of critical, single-source components.
Stockpiled inventory built up before the strike was sufficient to cover Lot 1B production. Everything after that is exposed. The Pentagon has resorted to borrowing-and-payback arrangements with foreign military sales customers — essentially reallocating parts earmarked for allied buyers back to U.S. production lines, then repaying the debt later — just to keep the line moving. That’s not a sustainable long-term fix; it’s a stopgap that shifts risk onto allied delivery schedules instead of eliminating it.
What This Means for Defense Contractors and Suppliers
For B2B readers in the defense and aerospace supply chain space, the actionable takeaways are:
- Single-source component risk is now a headline Pentagon concern, not a theoretical one. Any supplier or integrator still running single-vendor sourcing on flight-critical components (displays, engines, ejection systems) should expect increased scrutiny — and increased opportunity for qualified second-source suppliers.
- Supply chain visibility software and multi-tier risk modeling tools are likely to see increased defense-sector procurement interest as primes try to avoid a repeat of the Elbit/GE bottleneck on other programs.
- Labor relations at unionized aerospace primes are now a directly quantifiable program risk, one the Pentagon is willing to describe in a public acquisition document. Expect this to influence how future defense contracts price in labor-disruption contingencies.
- The F-15EX buy itself may be doubling in size even as the current lots run behind — the same Selected Acquisition Report flagged new cost and schedule uncertainty tied to an expanded production run, including warnings that radar, mission computer, electronic warfare, and engine systems could become obsolete over a longer timeline, requiring a “significant redesign effort” whose full cost hasn’t yet been estimated.
What Competitors Are Missing
Most defense trade coverage of the F-15EX delays stopped reporting once the strike itself ended in November 2025. The more important story — the one buried in an August 2026 acquisition document most outlets haven’t dug into — is that the schedule damage from that strike is now classified by the Pentagon as permanent, and that a second, ongoing bottleneck (Elbit displays and GE F110 engines) means the program isn’t fully back to healthy even ten months after the picket lines came down.
Timeline at a Glance
- Aug. 4, 2025 — St. Louis strike begins
- Oct. 2025 — Wilsbach confirms delivery delays in Senate testimony
- Nov. 13–17, 2025 — Strike ends
- Nov. 26, 2025 — First post-strike F-15EX delivered (142nd Wing, Portland ANG)
- Feb. 2026 — Air Force confirms delayed Kadena Air Base deployment
- Apr.–Jun. 2026 — Boeing targets doubling production rate to two jets/month
- Aug. 2026 — Selected Acquisition Report flags “unrecoverable delays” and parts shortages
People also Ask :
Q: Why are F-15EX Eagle II deliveries delayed?
A 102-day strike at Boeing’s St. Louis-area facilities (August–November 2025) halted F-15EX production, and a 2026 Pentagon acquisition report calls the resulting schedule slip “unrecoverable” — only about six of the contracted 12 Lot 3 jets will arrive by the end of 2026 instead of all 12 in early 2026. Ongoing shortages of Elbit-built cockpit displays and GE F110 engines are compounding the delay.
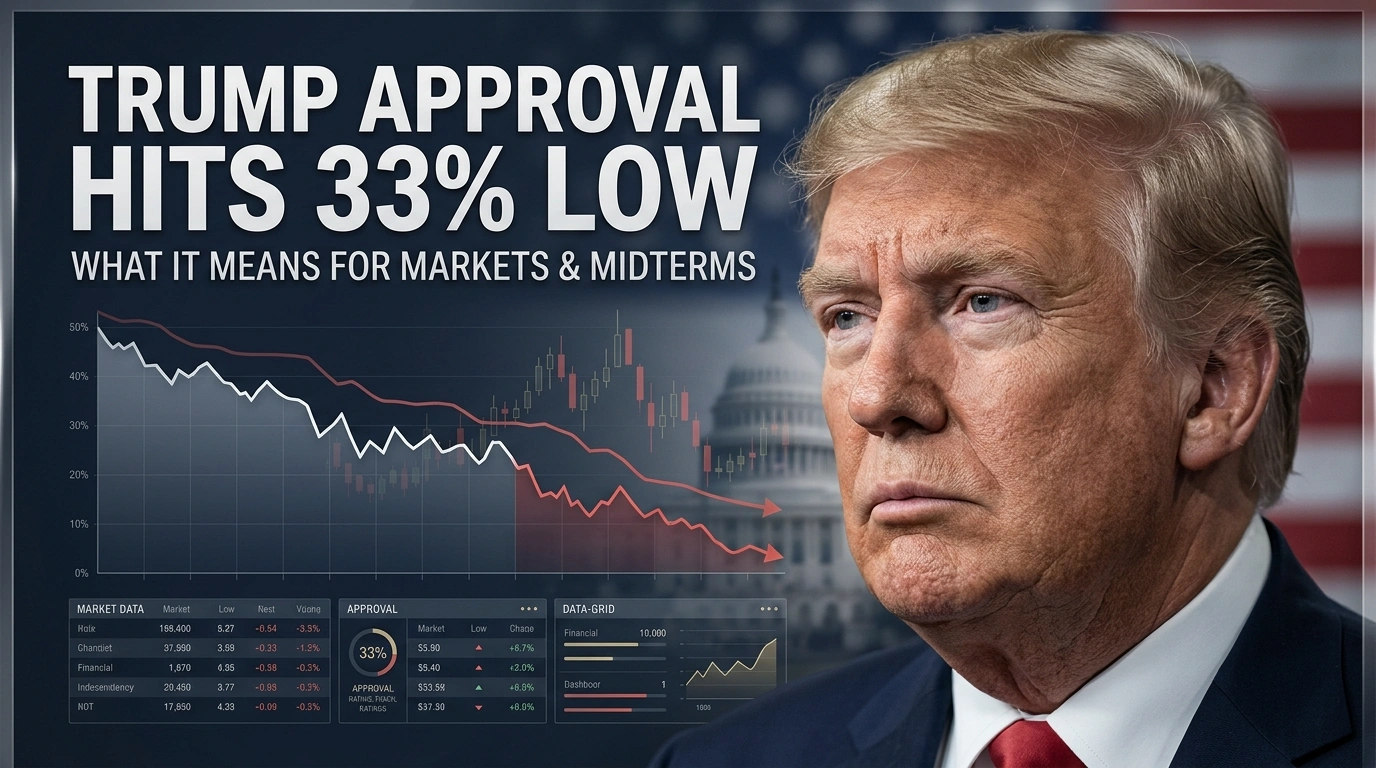
Trump’s approval rating has hit a second-term low of 33% in multiple polls this summer. Here’s what’s driving the decline, how it compares historically, and what it could mean for markets and the 2026 midterms.
Key Takeaways
- Trump’s approval rating has hit 33% in multiple independent polls this summer, including Reuters/Ipsos, The Economist/YouGov, and AP-NORC — a new low for his second term.
- The decline has been steep: Reuters/Ipsos polling shows a 14-point slide from 47% at the start of his second term to 33% now, with disapproval climbing from 41% to 65%.
- Polling averages remain somewhat higher than the lowest individual polls — the Decision Desk HQ average stood at 39.2%, illustrating the spread between different methodologies.
- The unpopular Iran conflict is a major drag: only 31% of Americans support continued U.S. military action, and 83% believe the conflict will continue for an extended period.
- Historical comparison is unfavorable: Trump’s current numbers trail his own first-term approval at the same point (41% in 2018) and are also below Biden’s comparable second-year approval (40% in August 2022).
Breaking Down the Numbers
Multiple independent polling organizations have converged on a similar, unflattering picture of President Trump’s standing heading into the 2026 midterms:
- Reuters/Ipsos: 33% approval, 65% disapproval (held steady across two consecutive surveys in mid-to-late August)
- The Economist/YouGov: 33% approval, a new low for that poll as of late August
- AP-NORC: 33% approval in a late-July survey — three points below Biden’s July 2022 approval and eight points below Trump’s own first-term July numbers
- Decision Desk HQ (DDHQ) average: 39.2%, the second-lowest since May, with 57.5% disapproving
The gap between the lowest individual polls (33%) and the polling average (around 39%) is a useful reminder for anyone tracking this story: individual polls can diverge meaningfully from methodology to methodology, and averages tend to smooth out the noise. Still, the consistent direction across virtually every major pollster — down, not up — is the more important signal than any single data point.
The Trajectory Matters as Much as the Level
According to Reuters/Ipsos tracking, Trump’s approval has fallen 14 points since the start of his second term, from 47% down to 33%, while disapproval has climbed 24 points, from 41% to 65%. That’s a significant and sustained erosion, not a single bad news cycle.
What’s Driving the Decline?
1. The Iran Conflict
An unpopular and prolonged U.S. military engagement with Iran is a significant drag on approval numbers:
- Only 31% of Americans support continued U.S. military action in Iran, down from 34% earlier in the summer and 37% in March.
- 83% of Americans believe the conflict will continue “for an extended period,” up from 80% earlier in the month — suggesting fatigue is building rather than easing.
- Approval of Trump’s handling of the Iran conflict specifically has declined even among Republicans, dropping from 71% to 61% in recent tracking, with just 48% of Republicans saying the U.S. should continue military action.
2. Economic Concerns
Polling context around the approval decline points to persistent economic anxiety among Americans as a contributing factor, compounding the foreign policy drag.
3. Historical Second-Term Pattern
Trump’s approval trajectory now trails not just his own first term, but also recent predecessors at comparable points:
| President | Approval at Comparable Point | Source |
|---|---|---|
| Trump (2026, second term) | 33% | Reuters/Ipsos |
| Trump (2018, first term, midterm year) | 41% | Reuters/Ipsos |
| Biden (August 2022) | 40% | Reuters/Ipsos |
Historical Context: What Happened Last Time Approval Was This Low Before a Midterm?
In the 2018 midterms — when Trump’s approval stood around 41%, notably higher than his current 33% — Republicans lost control of the House of Representatives, though the party gained two Senate seats. With his current approval running meaningfully below that benchmark, political analysts and Republican strategists are expressing heightened concern about the party’s ability to defend its congressional majorities in 2026.
Market and Investment Implications
Political Risk and Sector Exposure
Historically, periods of declining presidential approval heading into a midterm election can correlate with:
- Increased policy uncertainty premium in markets, particularly for sectors sensitive to potential legislative gridlock or shifts in regulatory posture.
- Elevated volatility in sectors tied to trade and foreign policy, given the Iran conflict’s direct role in the approval decline.
- Currency and bond market sensitivity to shifting expectations about fiscal policy continuity, particularly if control of Congress appears increasingly contested.
What History Suggests About Midterm-Year Market Performance
Markets have historically shown resilience through midterm election cycles regardless of which party is expected to gain seats, often pricing in political uncertainty well ahead of the actual vote. That said, sectors with direct regulatory or fiscal exposure — energy, defense, financial services, and healthcare — tend to see the most direct repricing around shifting congressional control expectations.
Actionable Takeaways for Investors and Political Observers
- Don’t overreact to a single poll. The spread between individual polls (33%) and polling averages (around 39%) illustrates why tracking multiple pollsters and trend direction matters more than any single headline number.
- Watch the Iran conflict closely as a specific, trackable driver of both approval numbers and potential market volatility — any de-escalation or further escalation is likely to move both simultaneously.
- Consider portfolio hedging strategies around sectors with direct regulatory exposure if you expect a competitive midterm environment to increase legislative gridlock risk.
- Track generic congressional ballot polling alongside presidential approval, as it offers a more direct read on likely House and Senate outcomes than approval ratings alone.
- Maintain a diversified portfolio rather than making concentrated bets based on political forecasting, given the inherent uncertainty in translating approval polling into specific electoral or market outcomes.
Frequently Asked Questions
What is Trump’s current approval rating? Multiple polls, including Reuters/Ipsos, The Economist/YouGov, and AP-NORC, have shown Trump’s approval rating at 33% as of late August 2026, while broader polling averages like Decision Desk HQ’s show a somewhat higher figure around 39%, reflecting the spread across different polling methodologies.
Why has Trump’s approval rating declined so much in 2026? Polling data points to an unpopular and prolonged U.S. military conflict with Iran, with only 31% of Americans supporting continued military action, alongside broader economic concerns, as significant contributing factors to the decline from 47% approval at the start of his second term to 33% now.
How might low presidential approval affect the stock market ahead of the midterms? Markets have historically shown general resilience through midterm election cycles, but sectors with direct regulatory or fiscal policy exposure — such as energy, defense, financial services, and healthcare — tend to experience more direct volatility around shifting expectations for congressional control, so investors may want to monitor generic ballot polling alongside approval ratings.

Climate Finance and the Economic Reality of Passing 1.5°C

Business Insurance for Digital Exports: Protecting Your Company in the AI Era

Real Estate Crash Predictions 2026: Data-Backed Regional Guide
Unrecoverable Delays: How the St. Louis Strike Crippled Boeing’s F-15EX Eagle II

What is a “Lead-Left” Bank? Unpacking Morgan Stanley’s Role in Anthropic’s Mega-IPO

How to Invest in the Anthropic IPO: Step-by-Step Guide for Retail Investors

Mario Kart 8 Deluxe 4.0.0 Patch Notes: 8-Player Split Screen & CameraPlay

Is SPY Overvalued in September 2026? Fed Rate Hike Odds & Intrinsic Value

Intel 18A Foundry Strategy 2027: Capital Burn, Stock Sales & Break-Even Timeline
Trump Approval Hits 33% Low: What It Means for Markets & Midterms

Crypto Trading: Why AI Tools Are Changing Gen Z Investing

AI Creator Deals: How Contracts Protect Influencers

Gen Z AI Skills: Online Degrees That Boost Job Prospects

AI Automation Tools Transform Gen Z Creator Careers

Pakistan’s KSE-100 Nears Record Territory Even as the Trade Gap Persists

US Consumer Sentiment Sinks as Retail Sales Drop
Barclays Q2 2026 Results: Income Beats, Costs Rise 7%
Pakistan’s Remittance Lifeline: Why Gulf Exposure Is a Hidden Risk
Dubai’s Rise to the World’s 7th Financial Hub: Inside the D33 Push
China EV Exports Hit Record High in 2026

Top 15 Stocks for Investment in 2026 in PSX: Your Complete Guide to Pakistan’s Best Investment Opportunities
Debunking IMF Program Myths: Reconfiguring Engagement for True National Ownership in a Volatile World
Top 10 Mutual Fund Managers in Pakistan for Investment in 2026: A Comprehensive Guide for Optimal Returns
What the U.S. Attack on Venezuela Could Mean for Oil and Canadian Crude Exports: The Economic Impact
China’s 50% Domestic Equipment Rule: The Semiconductor Mandate Reshaping Global Tech
15 Most Lucrative Sectors for Investment in Pakistan: A 2025 Data-Driven Analysis
Pakistan’s Export Goldmine: 10 Game-Changing Markets Where Pakistani Businesses Are Winning Big in 2025

Pakistan’s Stock Market Renaissance: How 2025’s Hottest Investment Opportunity Is Democratizing Wealth—A Complete Beginner’s Guide
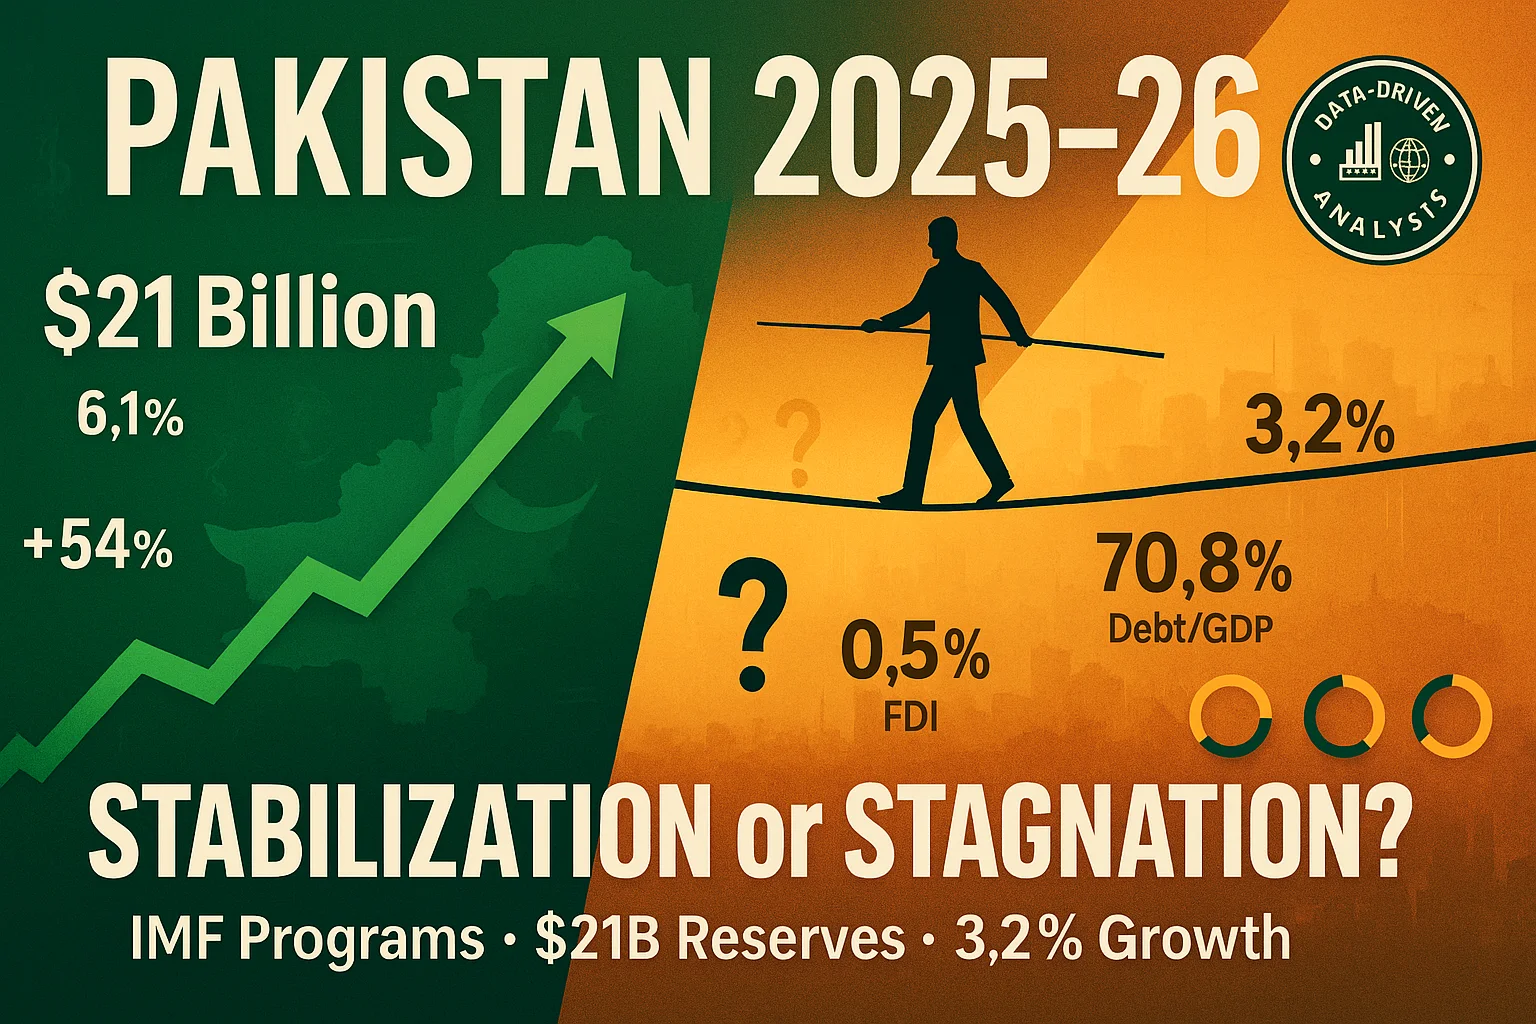
Pakistan’s Economic Outlook 2025: Between Stabilization and the Shadow of Stagnation
China’s Property Woes Could Last Until 2030—Despite Beijing’s Best Censorship Efforts

Best Investments in Pakistan 2026: Top 10 Low-Price Shares and Long-Term Picks for the PSX

How to Become an Active Taxpayer on Pakistan’s FBR Active Taxpayer List (ATL) in 2026: A Step-by-Step Guide
The Contours of 21st-Century Geopolitics Will Become Clearer in 2026: A New World Is Starting to Emerge

🌍 Davos 2026: The World Economic Forum Annual Meeting Sets the Stage for Global Transformation

The Institutional Era: A Comprehensive Cryptocurrency Investment Analysis for 2026

The New Executive Gold Standard: Top 10 Companies Lavishing Unprecedented Perks on CEOs and CFOs in 2025–2026
DBS Hits S$1 Billion AI Value Milestone — But Agentic AI Poses Talent Challenges for Singapore Banks

After Four Decades of Decline, Can Private Ownership Save Pakistan’s National Airline?
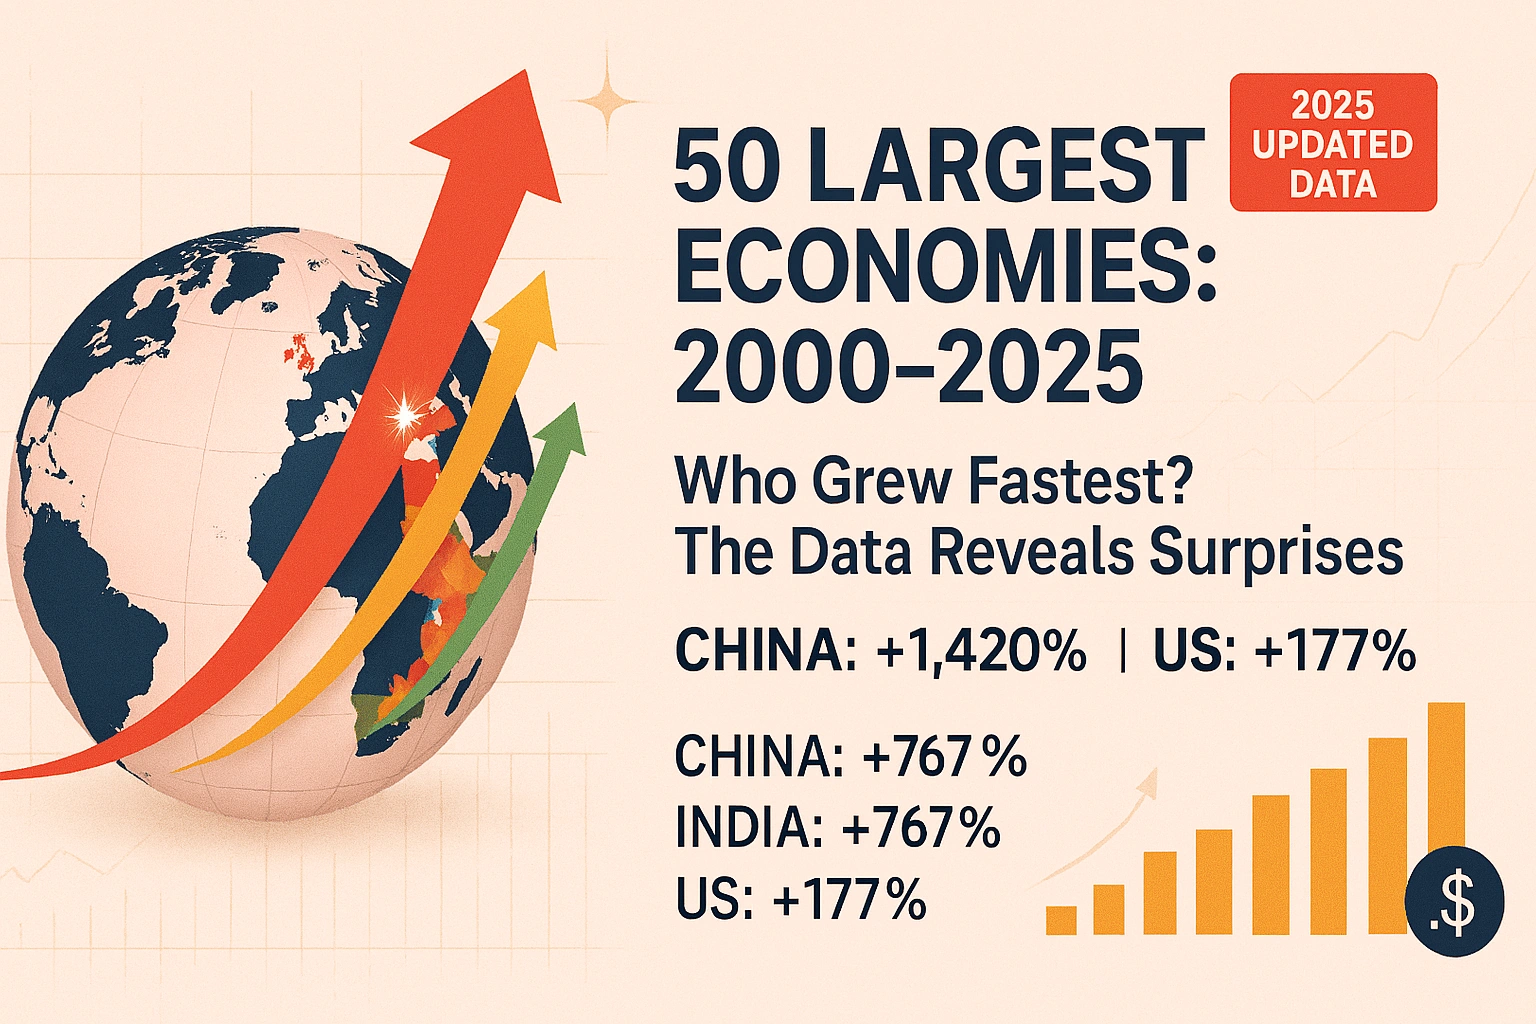
The World’s 50 Largest Economies: A 25-Year Growth Trajectory Analysis (2000-2025)
Resource Wealth and Geopolitical Vulnerability: Understanding Recent US Foreign Policy Toward Venezuela, Greenland, and Iran
-
Markets & Finance8 months ago
Top 15 Stocks for Investment in 2026 in PSX: Your Complete Guide to Pakistan’s Best Investment Opportunities
-
Analysis7 months ago
Debunking IMF Program Myths: Reconfiguring Engagement for True National Ownership in a Volatile World
-
Investment8 months ago
Top 10 Mutual Fund Managers in Pakistan for Investment in 2026: A Comprehensive Guide for Optimal Returns
-
Global Economy8 months ago
What the U.S. Attack on Venezuela Could Mean for Oil and Canadian Crude Exports: The Economic Impact
-
Asia8 months ago
China’s 50% Domestic Equipment Rule: The Semiconductor Mandate Reshaping Global Tech
-
AI8 months ago
15 Most Lucrative Sectors for Investment in Pakistan: A 2025 Data-Driven Analysis
-
Exports8 months ago
Pakistan’s Export Goldmine: 10 Game-Changing Markets Where Pakistani Businesses Are Winning Big in 2025
-
Global Economy9 months ago
Pakistan’s Stock Market Renaissance: How 2025’s Hottest Investment Opportunity Is Democratizing Wealth—A Complete Beginner’s Guide