
Global Economy
What the U.S. Attack on Venezuela Could Mean for Oil and Canadian Crude Exports: The Economic Impact

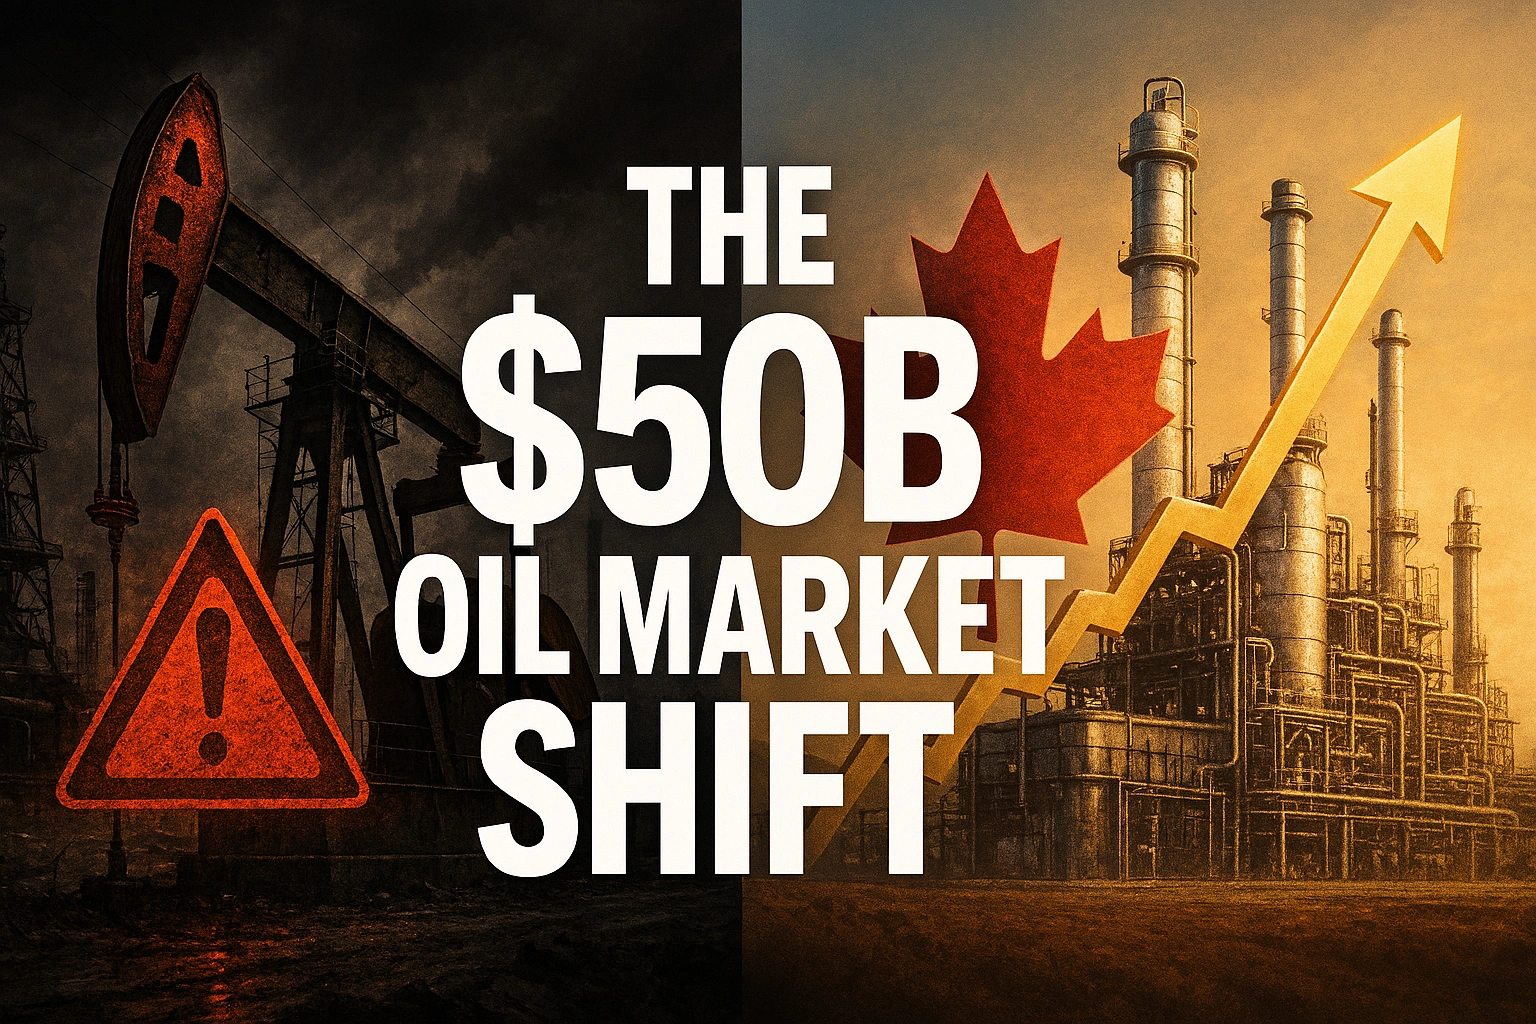
The aggressive U.S. pressure campaign against Venezuela’s oil sector is reshaping North American energy markets in ways few anticipated. The U.S. Treasury Department sanctioned four companies and oil tankers on December 31, 2025, as part of President Trump’s intensifying blockade against the Maduro regime, triggering a domino effect that positions Canada as an unexpected beneficiary in the global crude oil trade.
Here’s what this geopolitical shake-up means for oil prices, supply chains, and the $150 billion Canadian energy sector—and why investors, refiners, and policymakers are watching closely.
Understanding the U.S.-Venezuela Oil Relationship
The Escalating Sanctions Campaign
The Trump administration has sanctioned multiple vessels and companies involved in Venezuela’s shadow fleet operations, disrupting what remains of the country’s oil export capability. This isn’t just diplomatic posturing—it represents a fundamental disruption to hemispheric energy flows that have existed for decades.
Venezuela exports less than 1 million barrels per day, a small fraction of the 106 million barrels per day global oil market, according to analysis from the Center for Strategic and International Studies. Yet the strategic importance of Venezuelan heavy crude far exceeds its volume.
Venezuela’s Diminished Production Capacity
Venezuela’s oil production topped 3 million barrels per day in the early 2000s but has fallen sharply in recent decades due to declining investment and U.S. sanctions. The country once held the world’s largest proven oil reserves, but production infrastructure has deteriorated dramatically under years of economic mismanagement and international isolation.
Rebuilding Venezuela’s oil infrastructure would require investments of more than $100 billion and take at least a decade to lift production to 4 million barrels per day, according to Francisco Monaldi, director of the Latin America energy program at Rice University.
The Immediate Impact on Global Oil Markets
Gulf Coast Refineries Face a Critical Supply Gap
The reality facing U.S. refiners is more complex than simple supply and demand. Gulf Coast refiners favor heavy crude like Mexican Maya, as they typically run medium and heavy oil configurations, according to Wood Mackenzie analysis. Venezuelan heavy crude has historically filled a specific niche—high sulfur content, low API gravity—that perfectly matches the coking capabilities of sophisticated Gulf Coast refineries.
Gulf Coast refinery utilization started 2025 at 93% but has drifted to the mid-80% range as several mid-sized refineries cut runs by 5% to 10%. This decline isn’t entirely about Venezuelan supply disruptions—oversupply of light crude from the Permian Basin and compressed refining margins play significant roles—but the loss of heavy crude optionality constrains operational flexibility.
Price Volatility Remains Muted Despite Geopolitical Tensions
A continuing crackdown could throttle most or all of Venezuela’s exports and associated revenues, yet less than 20 percent of Venezuelan crude exports are transported on shadow tankers—a smaller proportion than Russian and Iranian barrels utilizing the same fleet.
West Texas Intermediate crude fell to $57.32 a barrel in January 2026, down from nearly $80 in January 2025, demonstrating that broader market factors currently outweigh Venezuela-specific disruptions. The International Energy Agency projects the oil market could see a surplus of 3.8 million barrels per day in 2026—the largest glut since the pandemic.
The Diesel Dilemma
There’s one product where Venezuelan supply matters disproportionately: diesel fuel. Venezuela produces a form of crude suitable for making diesel, which is widely used across industries. Removing Venezuela’s oil input from global markets could push up diesel costs in the U.S. and boost inflation, according to Atlantic Council analysis.
This creates an interesting paradox. While overall crude oil supply remains abundant, specific refined product markets could tighten, creating regional price dislocations that sophisticated traders will exploit.
Canada’s Strategic Opportunity in the Energy Landscape
Western Canadian Select Emerges as the Alternative
Enter Canada—and specifically, Western Canadian Select heavy crude. The characteristics that once made WCS a challenging product to market now make it invaluable. With API gravity between 20.5 and 21.5 degrees and sulfur content of 3.0 to 3.5 percent, WCS offers similar processing characteristics to Venezuelan crude.
The WTI-WCS price differential narrowed from $18.65 per barrel in 2023 to $14.73 per barrel in 2024, attributed to the commissioning of the Trans Mountain Pipeline Expansion in May 2024, according to the Alberta Energy Regulator.
The differential has been trading in a tight band between $10.25 and $11.70 under WTI since September 2025, with analysts pointing to strong international buying of Canadian crude off the Pacific coast. Even with seasonal widening, these differentials represent historically favorable pricing for Canadian producers.
Trans Mountain Pipeline: The Game-Changing Infrastructure
The Trans Mountain Pipeline Expansion isn’t just another infrastructure project—it fundamentally rewires North American energy geography. The expansion increased capacity from 300,000 to 890,000 barrels per day, nearly tripling throughput and increasing total western Canadian crude oil export pipeline capacity by 13%.
Within the first 12 months of operation, average pipeline movements of crude oil from Alberta to British Columbia increased more than fivefold, with total crude oil volumes exported through British Columbia surging by more than sixfold, according to Statistics Canada data.
The geographic diversification is remarkable. From May 2024 to April 2025, crude oil shipments to non-U.S. destinations accounted for 48.1% of exports by volume from British Columbia, compared to 100% going to the U.S. in the previous 12-month period.
Production Capacity Ramping Aggressively
Canadian crude oil production rose 9.4% year-over-year to 150 million barrels in January 2025, with exports totaling 129 million barrels, up from 125.5 million barrels a year earlier, according to data from Mansfield Energy citing Statistics Canada.
This production growth trajectory positions Canada as one of the most significant non-OPEC+ crude output growth stories globally. Oil sands producers are capitalizing on improved market access, ramping up production to fill new pipeline capacity.
Economic Implications for North America
U.S. Energy Security Gets More Complex
The U.S. relationship with Canadian crude isn’t simply transactional—it’s deeply integrated through decades of infrastructure investment and refinery optimization. In 2022, 79.2 percent of Canada’s refined oil came from the U.S., with Canadian crude refined in the Midwest and then sold back to Canada and the rest of the world, according to data from the Observatory of Economic Complexity.
This creates a fascinating interdependency. As Venezuela falls further out of the supply picture, U.S. refiners need Canadian heavy crude more than ever. Yet simultaneously, Canadian producers have new leverage through Pacific export options that didn’t exist two years ago.
The U.S. tariff threat that dominated headlines in early 2025 demonstrated this tension. Under the tariff case, the WCS price was expected to be 18% below the base case forecast at $45 per barrel due to a 10% U.S. tariff on Canadian energy products, resulting in a widening WCS-WTI differential.
Canadian Economic Growth Projections Improve
Since the expanded Trans Mountain pipeline came online, non-U.S. oil exports rose from about 2.5 percent of total exports to about 6.5 percent, according to Alberta Central economist Charles St-Arnaud. This diversification reduces Canada’s vulnerability to U.S. market dynamics and policy uncertainty.
The Alberta government expects the average WTI price to be $76.50 US, up $2.50 US per barrel from originally forecast, demonstrating the economic significance of improved market access.
The multiplier effects extend beyond direct oil revenues. Pipeline operations, tanker loading facilities, refinery upgrades, and related services generate substantial employment and tax revenue across Western Canada.
Investment Flows Redirect Northward
Canadian production is averaging five million barrels per day as of July 2025—up from 4.8 million in 2023—and is set to grow further into 2026, according to ATB Financial. This production growth requires billions in capital investment across the oil sands complex.
Energy analyst Rory Johnston projects year-over-year growth of 100,000 to 300,000 barrels per day through 2025, making Canada one of the largest sources of crude output growth globally. In a world where major international oil companies face pressure to constrain capital deployment, Canadian oil sands represent one of the few jurisdictions seeing significant production increases.
Geopolitical Ramifications Beyond North America
China Emerges as Canada’s Largest Pacific Buyer
China has become the top buyer of Canadian oil via the Trans Mountain pipeline at 207,000 barrels per day—a massive increase from an average of 7,000 barrels per day in the decade to 2023, according to Institute for Energy Research data.
This shift carries profound implications. Chinese refiners gain access to reliable heavy crude supplies outside U.S. jurisdictional reach, reducing their dependence on sanctioned sources like Iran and Venezuela. For Canada, Chinese demand provides price support and market optionality that didn’t exist when the U.S. was effectively the only customer.
Chinese oil purchases through the port near Vancouver soared to more than seven million barrels in March 2025 and were on pace to exceed that figure in April, while Chinese imports of U.S. oil dropped to three million barrels a month from 29 million barrels in June 2024.
Regional Stability Questions in Latin America
The U.S. seizure of shadow fleet tankers demonstrates that Washington is willing to physically halt exports of sanctioned oil, potentially throttling most or all of Venezuela’s exports. This aggressive enforcement creates precedents that extend beyond Venezuela.
Russia and China face outsized vulnerabilities in a world of greater sanctions enforcement that may include physical seizures. Washington’s actions could inspire other sanctioning authorities to implement similar operations, particularly in strategic chokepoints like the Danish straits.
OPEC+ Calculations Shift
Venezuela’s production decline removes a historically significant OPEC member from market balancing equations. While current Venezuelan output is modest, the country’s vast reserves and potential production capacity have always factored into long-term OPEC+ strategy.
Canada isn’t an OPEC member and has no production coordination with the cartel. Increased Canadian output essentially represents non-OPEC supply growth that OPEC+ must account for in its own production decisions. This dynamic could contribute to persistent oversupply conditions that depress prices.
Challenges and Risks Ahead
Infrastructure Bottlenecks Remain
Canadian crude exports from the Trans Mountain pipeline fell to 407 thousand barrels per day in June 2025, down 10.5% from May and 23.5% below the March record of 532 thousand barrels per day, according to Kpler data.
Peak seasonal maintenance and wildfire-related production disruptions that began in late May caused the decline, while strong inland U.S. demand from the Midwest and Gulf Coast reduced export availability. These operational realities demonstrate that even with new infrastructure, Canadian exports face constraints.
Enbridge Mainline was apportioned 4% in June 2025, with further apportionment expected in July, as demand from the Midwest and Gulf Coast competes for the same crude pool.
Environmental and Regulatory Headwinds
Canadian oil sands remain among the most carbon-intensive crude sources globally. As climate policies tighten—particularly in key markets like California and the European Union—carbon intensity creates both regulatory risk and reputational challenges.
California’s low-carbon fuel standards explicitly penalize high-carbon crude sources. While Asian buyers currently show less concern about carbon intensity, this could change as climate policies evolve. The $34 billion Trans Mountain expansion faced years of environmental opposition, demonstrating that future infrastructure projects will face significant regulatory hurdles.
Market Volatility Creates Planning Uncertainty
Oil prices fell to $57.32 per barrel in January 2026, dropping roughly 20% in 2025 and extending a decline over the previous two years. This price environment challenges the economics of capital-intensive oil sands development.
Oil sands projects require multi-billion-dollar investments with decades-long payback periods. Price volatility makes financial planning extraordinarily difficult. While improved market access through Trans Mountain helps, it doesn’t eliminate exposure to global price cycles.
Trans Mountain has become one of the most expensive routes for oil shippers due to toll increases necessary to cover construction cost overruns exceeding $34 billion. Higher transportation costs eat into producer netbacks, reducing the competitiveness of Canadian crude.
Expert Predictions and Future Outlook
Growing Asian Demand for Heavy Crude
Market analysts project continued growth in Asian demand for Canadian heavy crude, particularly as refineries complete infrastructure adaptations and develop expertise in processing oil sands products. This represents a fundamental shift in global crude trade flows.
Chinese and Indian refiners have invested billions in coking capacity specifically designed to handle heavy, high-sulfur crudes. As these facilities ramp up, they create structural demand for exactly the type of crude Canada produces in abundance.
Infrastructure Expansion Plans
Trans Mountain Corp is reviewing expansion projects for the line, with goals of increasing exports to Asian markets by adding between 200,000 and 300,000 barrels per day of capacity. Most of this additional capacity would likely target Asian rather than U.S. West Coast markets.
These expansion plans indicate confidence in long-term demand, but they also face the same political and environmental challenges that made the initial Trans Mountain expansion so contentious. Whether Canada can sustain the political will to approve major new energy infrastructure remains uncertain.
Long-Term Supply-Demand Balance Questions
Based on futures markets, the average price for WTI in 2026 is roughly $61 per barrel, down from the 2024 average of $76 per barrel, largely driven by concerns of slowing demand and an escalating global trade war, according to CAPP analysis.
The fundamental challenge facing the oil industry is that supply growth—from the U.S. shale, Canadian oil sands, Brazilian pre-salt, and Guyana—continues outpacing demand growth. Even with Venezuelan production effectively removed from the market, global oversupply persists.
This creates a paradoxical situation: Canadian producers gain market share and improve their strategic position while operating in an environment of depressed prices and margin pressure.
Key Takeaways: What This Means for Stakeholders
For U.S. Refiners: The loss of Venezuelan heavy crude creates dependency on Canadian and Mexican sources. Smart refiners are securing long-term Canadian crude supply contracts while the market remains oversupplied.
For Canadian Producers: The Trans Mountain expansion has created genuine optionality and improved netbacks, but success requires continued production efficiency improvements and market development in Asia.
For Investors: Canadian energy companies with low-cost oil sands operations and strong balance sheets look increasingly attractive. The sector faces headwinds from overall price weakness but structural advantages from improved market access.
For Policymakers: Energy security considerations increasingly favor North American supply chains. The U.S.-Canada energy relationship, despite periodic tensions, represents a strategic asset in an uncertain geopolitical environment.
For Asia’s Energy Buyers: Canadian crude offers reliable supply outside U.S. sanctions risk, though at the cost of higher transportation expenses and carbon intensity concerns.
The Bottom Line
The U.S. pressure campaign against Venezuela is accelerating a transformation already underway in North American energy markets. Canada isn’t simply filling a gap left by Venezuelan supply disruptions—it’s fundamentally repositioning as a globally connected crude exporter with options beyond its traditional U.S.-centric model.
The WTI-WCS price differential is anticipated to average $11 per barrel in 2025 as Trans Mountain enters its first full calendar year of operation. This represents the narrowest differential in years and reflects improved market access.
Yet significant uncertainties remain. Trade policy tensions between the U.S. and Canada could resurface. Global oil demand growth faces headwinds from electric vehicle adoption and efficiency improvements. Climate policies could penalize carbon-intensive crude sources.
What’s clear is that the era of Canadian crude as a captive supply to U.S. refineries has ended. The strategic implications of this shift—for energy security, geopolitics, and market dynamics—will play out over the coming decade.
For now, Canadian producers are capitalizing on a unique moment: Venezuelan production constrained by sanctions, new export infrastructure creating Asian market access, and global refiners seeking reliable heavy crude supplies. Whether this opportunity translates into sustained economic benefits depends on execution, market conditions, and policy developments that remain highly uncertain.
Frequently Asked Questions
Q: What is the impact of US sanctions on Venezuelan oil?
The U.S. has sanctioned multiple companies and vessels in Venezuela’s shadow fleet, disrupting the country’s ability to export crude oil and generating revenue for the Maduro regime. These sanctions effectively cut Venezuela off from most international oil markets, though some exports continue through sanctions evasion.
Q: How will Canadian crude exports benefit from the Venezuela situation?
Canadian crude benefits through five key mechanisms:
- Reduced competition from Venezuelan heavy crude in Gulf Coast refineries
- Trans Mountain Pipeline providing Asian market access
- Narrower price differentials due to improved market access
- Increased production justified by reliable export capacity
- Strategic positioning as a sanctions-free alternative to Venezuelan supply
Q: Why do Gulf Coast refineries need heavy crude oil?
Gulf Coast refineries invested billions in coking and conversion units specifically designed to process heavy, high-sulfur crude into valuable products like gasoline and diesel. These complex refinery configurations achieve higher margins when processing discounted heavy crude rather than more expensive light crude, making heavy crude supplies strategically important to their operations.








Global economic growth in 2026 is growing increasingly uneven, capital is becoming far more sensitive to financing costs, and discerning a compelling narrative from an investable asset price is crucial. Rather than promising guaranteed returns, this guide outlines essential research methods and key market risks. While the IMF’s October 2026 outlook projects global growth at 3.1% and inflation at 4.7%, its financial-stability report cautions that underlying vulnerabilities persist beneath current market resilience.
Key takeaways
- Match each investment decision to its time horizon, currency and ability to withstand losses.
- Separate observable earnings or contractual cash flows from optimistic forecasts.
- Compare diversification, fees, taxes, liquidity and regulatory restrictions before committing capital.
- Track primary institutional evidence and update assumptions when conditions change.
- Readers in Pakistan should consider rupee exposure and availability of regulated investment channels.
Why this matters now
The central question behind global recession risk 2026 is not merely what may happen next. It is which economic mechanisms could change cash flow, purchasing power or risk. The Bank for International Settlements’ 2026 review describes an economy supported by technological investment but constrained by geopolitical and fiscal pressures. A robust financial plan must therefore survive both a favourable and an adverse scenario.
Start with the baseline, not the frightening headline
The IMF forecast 3.1% global growth in 2026 and 3.4% in 2027, implying continued expansion under its baseline rather than an outright worldwide recession. Nevertheless, forecasts can miss shocks. Investors should monitor a basket of labour, credit, trade, earnings and inflation indicators rather than treating any single signal as destiny. See the primary institutional research.
For practical analysis, separate the baseline, the upside case and the downside case. Document the specific development that would change your assessment. Assess timing: a promising long-term theme may still be inappropriate for cash needed within twelve months.
Yield curves and interest-rate expectations
An inverted yield curve can reflect expectations of weaker activity or future interest-rate cuts, but term premiums and central-bank balance sheets complicate interpretation. A subsequent steepening may accompany either improving growth expectations or falling short-term rates during a downturn. Context matters more than a mechanical threshold. See the primary institutional research.
For practical analysis, separate the baseline, the upside case and the downside case. Document the specific development that would change your assessment. Assess timing: a promising long-term theme may still be inappropriate for cash needed within twelve months.
Credit spreads and lending conditions
Widening differences between risky and safe bond yields can reveal anxiety about defaults and funding. Banks tightening lending standards may reduce business investment and household spending. Monitor multiple jurisdictions: financial stress in one country need not translate into a worldwide contraction, but global funding networks can spread pressure. See the primary institutional research.
For practical analysis, separate the baseline, the upside case and the downside case. Document the specific development that would change your assessment. Assess timing: a promising long-term theme may still be inappropriate for cash needed within twelve months.
Jobs, production and trade
Unemployment changes, hours worked, purchasing-manager surveys and industrial production indicate demand and business confidence. Trade shipment data add external perspective. Monthly releases can be revised, and some indicators lag turning points. Use three-month trends alongside annual comparisons to avoid mistaking seasonal noise for a regime change.
For practical analysis, separate the baseline, the upside case and the downside case. Document the specific development that would change your assessment. Assess timing: a promising long-term theme may still be inappropriate for cash needed within twelve months.
What investors in Pakistan should monitor
Foreign remittances, import payments, export orders, the rupee and international oil prices transmit global stress to domestic conditions. Preserve liquidity for essential obligations and review high-leverage exposure. In uncertain markets, a disciplined allocation and rebalancing policy is usually more defensible than an all-or-nothing recession bet. See the primary institutional research.
For practical analysis, separate the baseline, the upside case and the downside case. Document the specific development that would change your assessment. Assess timing: a promising long-term theme may still be inappropriate for cash needed within twelve months.
Comparison and decision framework
| Question | Stronger evidence | Warning sign |
|---|---|---|
| What drives returns? | Audited cash flows, clear contract or transparent index | Undefined or projected returns |
| What can go wrong? | Explicit scenario and downside analysis | Claims of guaranteed gains |
| Is it affordable to hold? | Low transparent fees and adequate liquidity | Leverage, costly spreads or lockups |
| Is access legitimate? | Appropriate licensing and clear legal rights | Unverified brokers or custody |
| Is the exposure diversified? | Multiple independent sources of return | One company, sector or currency |
What it means for Pakistani savers and investors
A Pakistani reader faces both international investment risk and local purchasing-power risk. For example, a foreign asset can rise in US-dollar terms while the rupee conversion and transaction costs alter the realized local outcome. The opposite can also occur. Record the starting exchange rate, applicable taxes, custody charges and capital-transfer restrictions, and confirm current requirements with the State Bank of Pakistan and the relevant securities regulator. Overseas access should not be assumed universally available.
An emergency reserve, expensive consumer debt and near-term family obligations deserve attention before any speculative allocation. A portfolio that cannot meet a sudden cash requirement may force sales at the worst moment. The objective is not to remove risk—impossible in markets—but to choose risks that fit the investor’s actual liabilities.
Risks, limitations and uncertainty
Institutional forecasts are conditional and can change after policy decisions, commodity shocks, conflict escalation or unexpectedly weak earnings. Historic correlations are not binding promises about future asset performance. The analysis does not provide live stock prices, current investment product quotes, real-time exchange rates or individualized tax advice. Prices, regulations and product eligibility should be checked on the transaction date.
Frequently asked questions
Is this a guaranteed investment opportunity?
No. Every financial asset or strategy involves uncertainty. The existence of a popular investment theme is not evidence that an individual security is fairly priced.
What should beginners examine first?
Understand the product, the financial loss you could tolerate, fees and liquidity. Verify the provider and decide whether the money may be needed soon.
How do interest rates affect the analysis?
They influence financing costs, discount rates, exchange rates and demand. The effect differs by sector, maturity and business balance sheet.
Can Pakistani residents invest in foreign markets?
Access depends on current foreign-exchange, banking, brokerage, securities and tax rules, and on the investor’s individual circumstances. Check current regulations and regulated providers rather than assuming access.
How often should this analysis be refreshed?
Review institutional economic releases monthly and re-evaluate immediately after material earnings, regulatory or policy changes. Avoid reacting mechanically to every daily market movement.
Is diversification enough to prevent losses?
No. Diversification may reduce company-specific risk but cannot eliminate broad market, currency, inflation or systemic risks.
Conclusion
Sound financial decisions begin with verifiable evidence, reasonable valuation, awareness of uncertainty and a plan that survives adverse outcomes. Readers should compare multiple independent sources and avoid letting a compelling headline substitute for due diligence.

Enterprise generative AI in 2026 presents a genuine paradox: adoption is nearly universal, individual productivity gains are well-documented and real, and yet the majority of organizations still cannot point to measurable enterprise-wide financial return. Understanding that gap — not simply citing adoption statistics — is now the central strategic question for any organization evaluating its AI investment.
The Adoption-to-Impact Gap, By the Numbers
| Metric | 2026 Data | Source |
|---|---|---|
| Organizations using AI in at least one business function | 88–90% | McKinsey / Stanford AI Index |
| Organizations reporting generative AI use specifically | 70–72% | Stanford AI Index / Menlo Ventures |
| CEOs reporting “nothing” or zero measurable ROI | 56% | PwC January 2026 CEO Survey (n=4,454) |
| Organizations seeing significant ROI from generative AI | 29% | 2026 enterprise adoption survey |
| AI projects moving to production achieving positive ROI within 12 months | 44% | Forrester |
| Organizations that have scaled AI beyond pilot stage | ~33% | Multiple 2026 surveys |
| Enterprise generative AI spending growth, 2024→2025 | +222%, reaching $37 billion | Menlo Ventures |
Axis Intelligence Research’s AI Productivity Gap Index (APGI) scores the 2026 landscape at 68.4 out of 100, placing enterprise AI firmly in “Large Gap” territory — worse than the documented adoption-to-impact gaps observed during the 2011–2014 cloud computing adoption cycle or the 2013–2016 enterprise social media adoption cycle. This is a genuinely useful historical anchor: it suggests the current gap between AI deployment and AI value capture, while frustrating to executives, is not unprecedented for a fast-diffusing enterprise technology — but it is currently worse than the two most recent comparable technology cycles.
Why Individual Gains Aren’t Converting to P&L Impact
The productivity gains at the individual level are genuinely substantial and well-measured:
- Active Microsoft 365 Copilot users save 14 to 26 minutes per day, per Microsoft’s own early-user research and a UK government trial respectively.
- Active OpenAI Enterprise users save 40 to 60 minutes per day, according to Goldman Sachs’ reporting of OpenAI usage data from December 2025.
- Individual productivity gains from generative AI tools reach 5x in documented cases, per 2026 enterprise adoption survey data.
- Accenture estimates the average productivity value of generative AI tools at $7,800 per employee per year for knowledge workers.
The conversion failure happens at the aggregation layer. ModelOp’s 2026 survey of 100 senior AI enterprise leaders found that two-thirds of AI-spending organizations rely on estimates of time saved rather than measured financial outcomes to assess ROI — meaning most organizations cannot actually trace individual time savings through to a documented P&L line, even when the underlying time savings are real. PwC’s April 2026 AI Performance Study identifies what separates the top-performing 20% of organizations: they pursue growth (new products, market expansion) alongside efficiency, rather than treating AI purely as a cost-reduction lever — a strategic distinction that appears to be the single strongest predictor of realized enterprise value.
What’s Actually Driving the Failure Modes
Across the 2026 survey literature, five recurring root causes explain why individual productivity gains fail to scale into enterprise transformation:
- Isolated tactical implementation rather than enterprise-wide deployment — pockets of AI usage within specific teams that never integrate into core workflows or systems of record.
- Insufficient data quality and infrastructure — Gartner projects that 60% of AI projects unsupported by AI-ready data will be abandoned through 2026, reinforcing that the primary blocker is data readiness, not model capability.
- Misalignment between AI initiatives and business strategy — AI deployed because it’s available, not because it’s mapped to a specific, measurable business outcome.
- Inadequate change management — 54% of C-suite executives admit adopting AI is “tearing their company apart” internally, reflecting genuine organizational friction rather than pure technology limitation.
- Lack of clear measurement frameworks — the two-thirds of organizations relying on estimated rather than measured outcomes noted above is both a symptom and a cause of this failure mode.
Return-on-Investment Benchmarks Where They Exist
Despite the aggregate gap, credible ROI benchmarks do exist for organizations that have moved past pilot stage:
- McKinsey Global AI Survey: 5.8x average ROI on AI investment within 14 months of production deployment.
- IDC/Microsoft: 3.7x average return per $1 invested in generative AI.
- Forrester Total Economic Impact studies: cite cases of 333% ROI with a six-month payback period for organizations using enterprise-grade platforms with structured deployment.
- Google Cloud’s ROI of AI research: 74% of executives whose organizations use generative AI report ROI within the first year, rising to 88% among agentic-AI early adopters specifically — suggesting agentic (task-executing) AI deployments may be converting to measured ROI faster than general-purpose generative AI usage.
- KPMG’s Q1 2026 AI Quarterly Pulse Survey: 62% of U.S. organizations have achieved measurable ROI or expect it within the next 12 months.
The dispersion across these figures (3.7x to 5.8x average ROI, but also 56% of CEOs reporting zero ROI) is itself the key finding: ROI in enterprise AI is currently bimodal, not normally distributed — organizations either are capturing substantial, measured returns through structured deployment, or are capturing effectively none, with comparatively few landing in a modest-middle-ground outcome.
The Security Governance Dimension: Shadow AI
Parallel to the ROI question, 2026 has been the year enterprise AI security risk moved from theoretical to quantified and regulatory:
- IBM’s Cost of a Data Breach Report 2026 (published July 29, 2026, studying 602 breached organizations across 17 industries and 16 countries) found shadow AI — unauthorized, unapproved AI tool usage — involved in 43% of security incidents, up sharply from roughly one in five the prior year.
- Shadow AI increases average breach costs by $670,000 per incident and adds roughly 10 days to breach identification and containment timelines, per IBM’s data.
- Visibility remains the core governance failure: only 25% of organizations report comprehensive visibility into how employees actually use AI tools, while 35% describe shadow AI usage as pervasive or widespread within their organization.
- Only 37% of organizations have formal AI governance policies in place — meaning 63% are currently operating without documented guardrails, per IBM 2025 data cited across multiple 2026 governance reports.
Regulatory Timeline: The EU AI Act Compliance Clock
Governance is no longer purely a voluntary best-practice question. Under the EU AI Act implementation timeline, most remaining provisions began applying August 2, 2026, with member states now required to maintain at least one national AI regulatory sandbox. A further compliance milestone follows August 2, 2027, when Article 6(1) obligations and legacy general-purpose model compliance requirements take effect. For any organization processing EU data or serving EU customers, ungoverned AI use is now a documented regulatory exposure, not solely a security concern.
Governance Frameworks Auditors Increasingly Expect
Three frameworks have emerged as the reference points defining “reasonable care” in enterprise AI governance:
- NIST AI Risk Management Framework, structured around four functions: Govern, Map, Measure, and Manage.
- ISO/IEC 42001, the certifiable AI management system standard (published December 2023, now increasingly referenced in enterprise audits).
- NIST Cybersecurity Framework 2.0, which added a dedicated Govern function mapping directly onto AI-specific oversight requirements.
What Separates High-ROI Organizations from the 56% Reporting Nothing
Synthesizing across the 2026 research base, the organizations capturing measured, enterprise-wide ROI share a consistent pattern:
- They pursue growth use cases alongside efficiency, not efficiency alone (PwC’s top-performing-20% finding).
- They deploy approved AI tools with real-time coaching rather than blanket bans, which one healthcare-system case study found reduced unauthorized shadow AI usage by 89% while still capturing productivity gains — demonstrating that governance and productivity are not inherently in tension when implemented well.
- They measure financial outcomes directly rather than relying on estimated time-savings as a ROI proxy.
- They treat AI governance as infrastructure, not paperwork — Gartner projects AI governance spending will reach $492 million in 2026 and surpass $1 billion by 2030, reflecting genuine budget commitment rather than compliance-theater spending among leading organizations.
Bottom Line
Enterprise generative AI in 2026 has achieved near-universal adoption and well-documented individual productivity gains — but the majority of organizations still cannot convert those gains into measured, enterprise-wide financial return, with 56% of CEOs reporting zero measurable ROI even as documented benchmarks show 3.7x to 5.8x returns are achievable. The differentiator is not the technology itself but organizational execution: structured deployment paired with genuine financial measurement, growth-oriented rather than purely cost-focused use cases, and governance frameworks robust enough to manage the shadow AI risk now implicated in 43% of security incidents — all under an EU AI Act compliance clock that started running in August 2026.

On September 2, 2026, the UN Environment Programme published a report that treated something once framed as a worst-case risk as a settled outcome: the world will pass 1.5°C of warming. “Limiting Overshoot: Navigating Exceedance of 1.5°C and Pathways Towards Return” marks a deliberate shift in framing, from preventing a threshold breach to managing one already underway — with direct, quantified consequences for climate finance, carbon-removal markets, and the economics of adaptation that businesses and investors now need to plan around.
Key Takeaways
- UNEP’s September 2, 2026 report puts best-case peak warming at 1.8°C even under the most optimistic current government pledges, with a median of around 2.6°C by 2100 (range 1.9°C–3.6°C) under current policies — treating overshoot of the Paris Agreement’s 1.5°C goal as effectively locked in.
- The remaining global carbon budget for a 50% probability of staying within 1.5°C is roughly 130 gigatonnes of CO2 as of 2026 — at current annual emissions of nearly 40 GtCO2, this budget could be exhausted within approximately three years.
- Global disaster losses, including broader economic and ecological damage, already exceed $2.3 trillion annually, according to the UN’s 2026 climate report, while international climate finance reached just $136.7 billion in 2024 — a gap of well over an order of magnitude between damage and financing.
- Carbon dioxide removal (CDR) at the scale needed to return to 1.5°C will cost trillions of dollars, with per-tonne costs estimated at over $100 and ranging up to $1,000 or more depending on the removal method, according to the State of Carbon Dioxide Removal’s Third Edition (2026).
- The Fund for Responding to Loss and Damage held pledges of only around $800 million as of late 2025, a figure researchers describe as dramatically short of documented developing-country needs — underscoring the financing gap at the center of overshoot economics.
From Prevention to Management: A Deliberate Reframing
UNEP’s own annual Emissions Gap Report has tracked the shortfall between climate pledges and required pathways since 2010, but the September 2026 “Limiting Overshoot” report represents a structural change in framing rather than a change in the underlying science. Rather than treating a breach of 1.5°C as an endpoint or failure state, the report proposes an “overshoot, peak, and decline” framework: limiting the maximum level of warming reached, then working to enable a gradual return toward safer conditions over subsequent decades. As UN Secretary-General António Guterres put it in comments accompanying the report’s launch, humanity must pursue “an overshoot of ambition” — accelerating fossil fuel phaseout, slashing methane pollution, and protecting land, forests, and oceans simultaneously, rather than sequencing mitigation and adaptation as separate phases.
The report’s own numbers make clear why this reframing was considered necessary: even the most optimistic scenario incorporating all current government pledges puts expected peak warming at 1.8°C, while continuation of current policies (without stronger pledges) produces a median projection of roughly 2.6°C by century’s end, with a plausible range extending to 3.6°C. Human-induced warming is already approaching 1.4°C and increasing at roughly 0.25°C per decade — a trajectory that leaves essentially no realistic path to avoiding at least a temporary breach of the 1.5°C threshold.
The Carbon Budget Arithmetic
The remaining global carbon budget for a 50% probability of holding warming within 1.5°C stands at roughly 130 gigatonnes of CO2 as of 2026. Against current annual global emissions of nearly 40 gigatonnes, this budget could be exhausted within approximately three years at present emissions rates — a timeline that explains why the report treats exceedance as the base case for planning purposes rather than a tail risk. This arithmetic is central to why the report’s “overshoot, peak, and decline” framework requires not merely emissions reduction but active carbon dioxide removal (CDR) at scale to eventually bring atmospheric concentrations back down, rather than emissions reduction alone.
Tipping Point Risk: The Non-Linear Cost of Overshoot Duration
The UNEP report identifies four specific tipping elements where sustained warming above 1.5°C raises materially elevated risk: the West Antarctic Ice Sheet, the Greenland Ice Sheet, the Atlantic Meridional Overturning Circulation (AMOC), and the climate-biosphere system of the Amazon rainforest. Notably, the report deliberately declines to attach specific temperature thresholds to these tipping points, instead emphasizing that risk increases with both the degree and — critically for economic planning — the duration of overshoot. This duration-sensitivity is central to the report’s economic logic: the longer warming remains above 1.5°C, the greater the cumulative risk of triggering one or more of these systems, with some — such as AMOC weakening — showing model-projected recovery only on a timescale of centuries even if peak warming is later reduced.
This non-linearity matters directly for climate finance and insurance-sector risk modeling: a framework that treats overshoot duration, not just peak magnitude, as the key risk variable implies that near-term emissions reduction and carbon removal investment carry outsized value in limiting tail risk, even if 1.5°C itself is no longer avoidable as a peak.
The Financing Gap: Quantifying the Shortfall
The UN’s broader 2026 climate reporting places global disaster losses — including direct economic damage and broader ecological costs — at over $2.3 trillion annually. Against this figure, international climate finance flows reached just $136.7 billion in 2024, a gap exceeding an order of magnitude between documented damage and available financing. Climate officials have consistently framed this financing not as charitable transfer but as a protective investment against larger future losses — arguing that extreme weather, disrupted agriculture, damaged infrastructure, and displaced populations carry costs to the global economy that substantially exceed the cost of preventive action.
The financing gap is starkest in the Loss and Damage architecture specifically: the Fund for Responding to Loss and Damage held pledges of only around $800 million as of late 2025, against developing-country needs that researchers have estimated run dramatically higher — a mismatch the UNEP report explicitly identifies as an area requiring strengthened international financial commitment, particularly given the report’s emphasis on Common but Differentiated Responsibilities and Respective Capabilities (CBDR-RC) as a governing principle for how overshoot’s costs should be distributed.
The Economics of Carbon Dioxide Removal
Because the “overshoot, peak, and decline” pathway requires active carbon removal to eventually bring warming back toward 1.5°C, CDR economics have become directly material to climate finance planning in a way they were not when 1.5°C avoidance still seemed achievable through emissions reduction alone. The State of Carbon Dioxide Removal’s Third Edition (2026) estimates that many CDR approaches cost over $100 per tonne of CO2 removed, with some methods running $1,000 or more — and that deploying CDR at the annual billion-tonne scale required to meaningfully support a return to 1.5°C will cost trillions of dollars in cumulative terms, posing a genuine financial constraint on the pathway’s feasibility.
UNEP’s 2026 analysis separately and explicitly rules out solar radiation management (SRM) as a viable substitute or complement at this stage, characterizing the evidence base as limited, largely theoretical, and concentrated in a handful of countries — with significant equity implications given that SRM deployment location could produce regionally uneven climate impacts. This effectively narrows the overshoot-management toolkit to emissions reduction plus CDR, reinforcing the trillion-dollar-scale financing requirement rather than offering a lower-cost technological alternative.
Heat, Labor, and Productivity: An Underpriced Economic Risk
Beyond direct disaster losses, the UNEP report highlights heat-related productivity losses as a specific and growing economic risk channel: increasing humid heat is projected to significantly reduce outdoor labor capacity, deepening economic losses specifically in vulnerable, often lower-income countries with large outdoor and agricultural workforces. This risk channel — distinct from more visible disaster-loss categories like flooding or storm damage — represents a slower-moving but potentially larger cumulative economic cost that current climate finance flows are not clearly calibrated to address.
Implications for ESG Finance and Corporate Climate Strategy
- Adaptation finance requires a step-change, not incremental growth. The UN Secretary-General has specifically called on developed countries to triple adaptation finance and ensure it reaches those most at risk — a target that implies current adaptation financing trajectories are viewed as fundamentally inadequate given the now-explicit overshoot scenario.
- CDR investment carries genuine but expensive strategic value. With per-tonne CDR costs ranging from roughly $100 to over $1,000, ESG and climate-focused investors should differentiate between lower-cost, more scalable removal methods and premium, higher-certainty approaches when evaluating portfolio exposure to carbon removal markets.
- Loss and Damage exposure should be modeled as a growing, underfunded liability. With pledged funding around $800 million against dramatically larger documented needs, businesses operating in climate-vulnerable regions should anticipate continued political and financial pressure for expanded corporate and national contributions to this specific financing mechanism.
- Duration-sensitive tipping point risk argues for front-loaded mitigation investment. Because the UNEP framework treats overshoot duration — not just peak temperature — as the key driver of tipping-point risk, near-term mitigation spending carries a risk-reduction value that a pure peak-temperature framing would understate.
Frequently Asked Questions
Has the world already passed the 1.5°C climate threshold?
UNEP’s September 2026 report treats a temporary breach of 1.5°C as effectively locked in given current emissions trajectories, with best-case peak warming projected at 1.8°C even under optimistic government pledges, and the remaining carbon budget for a 50% chance of avoiding breach possibly exhausted within about three years.
How big is the gap between climate damage and climate finance?
Substantial — global disaster losses exceed $2.3 trillion annually according to UN 2026 reporting, while international climate finance reached only $136.7 billion in 2024, an order-of-magnitude gap between documented damage and available financing.
How much will it cost to bring warming back down to 1.5°C after overshoot?
Carbon dioxide removal at the scale needed will cost trillions of dollars cumulatively, with per-tonne costs ranging from roughly $100 to $1,000 or more depending on the removal method, according to the State of Carbon Dioxide Removal’s Third Edition (2026).
Conclusion
The UNEP’s September 2026 “Limiting Overshoot” report represents a genuine inflection point in climate policy framing — an acknowledgment that 1.5°C avoidance is no longer the operative planning assumption, replaced by a more complex “overshoot, peak, and decline” pathway with its own distinct, quantifiable economics. For climate finance, ESG investment strategy, and corporate risk planning, the practical implications are concrete: a financing gap measured in trillions rather than billions, a carbon removal market that must scale to unprecedented size at meaningful cost, and a tipping-point risk profile where the duration of overshoot — not merely its peak — will determine how much of this economic cost becomes irreversible.

US Impeachment Talk and White House Press Secretary Changes: What the Record Shows

2026 Economic Outlook: Investment Tips for Pakistani Investors

Anduril’s $6.6 Billion Submarine Shipyard Plan Explained

Life Insurance Comparison: Term vs. Whole Life and What Each Actually Costs

Stock Market Today: Nasdaq Hits Record High as Dow and S&P 500 Stumble on Middle East Diplomatic Shifts

Energy Market Spikes vs. Consumer App Data: What GasBuddy and Crude Prices Signal for Inflation

China’s FTAAP Push for APEC 2026 in Shenzhen: US Tariffs and Unite Asia-Pacific

AI Stocks Slide After Industry Leaders Call for a Development Slowdown

Singapore Stocks vs. Japan Stocks: Safe Havens in the Asian Economic Slowdown

Agentic AI in Finance: How Artificial Intelligence Is Replacing Routine Tasks on Wall Street

Fiscal Deficit and Public Debt

T-Mobile’s Enterprise Push and the Evolution of Modern Corporate Mobility Solutions

Enterprise Generative AI ROI 2026: The Adoption-to-Impact Gap Explained

Climate Finance and the Economic Reality of Passing 1.5°C

Business Insurance for Digital Exports: Protecting Your Company in the AI Era

Real Estate Crash Predictions 2026: Data-Backed Regional Guide

Unrecoverable Delays: How the St. Louis Strike Crippled Boeing’s F-15EX Eagle II

What is a “Lead-Left” Bank? Unpacking Morgan Stanley’s Role in Anthropic’s Mega-IPO

How to Invest in the Anthropic IPO: Step-by-Step Guide for Retail Investors

Mario Kart 8 Deluxe 4.0.0 Patch Notes: 8-Player Split Screen & CameraPlay

Top 15 Stocks for Investment in 2026 in PSX: Your Complete Guide to Pakistan’s Best Investment Opportunities

Debunking IMF Program Myths: Reconfiguring Engagement for True National Ownership in a Volatile World
China Economy 2026: Property Crisis, AI Investment & Export Surplus Explained

Top 10 Mutual Fund Managers in Pakistan for Investment in 2026: A Comprehensive Guide for Optimal Returns
China’s 50% Domestic Equipment Rule: The Semiconductor Mandate Reshaping Global Tech
What the U.S. Attack on Venezuela Could Mean for Oil and Canadian Crude Exports: The Economic Impact
15 Most Lucrative Sectors for Investment in Pakistan: A 2025 Data-Driven Analysis
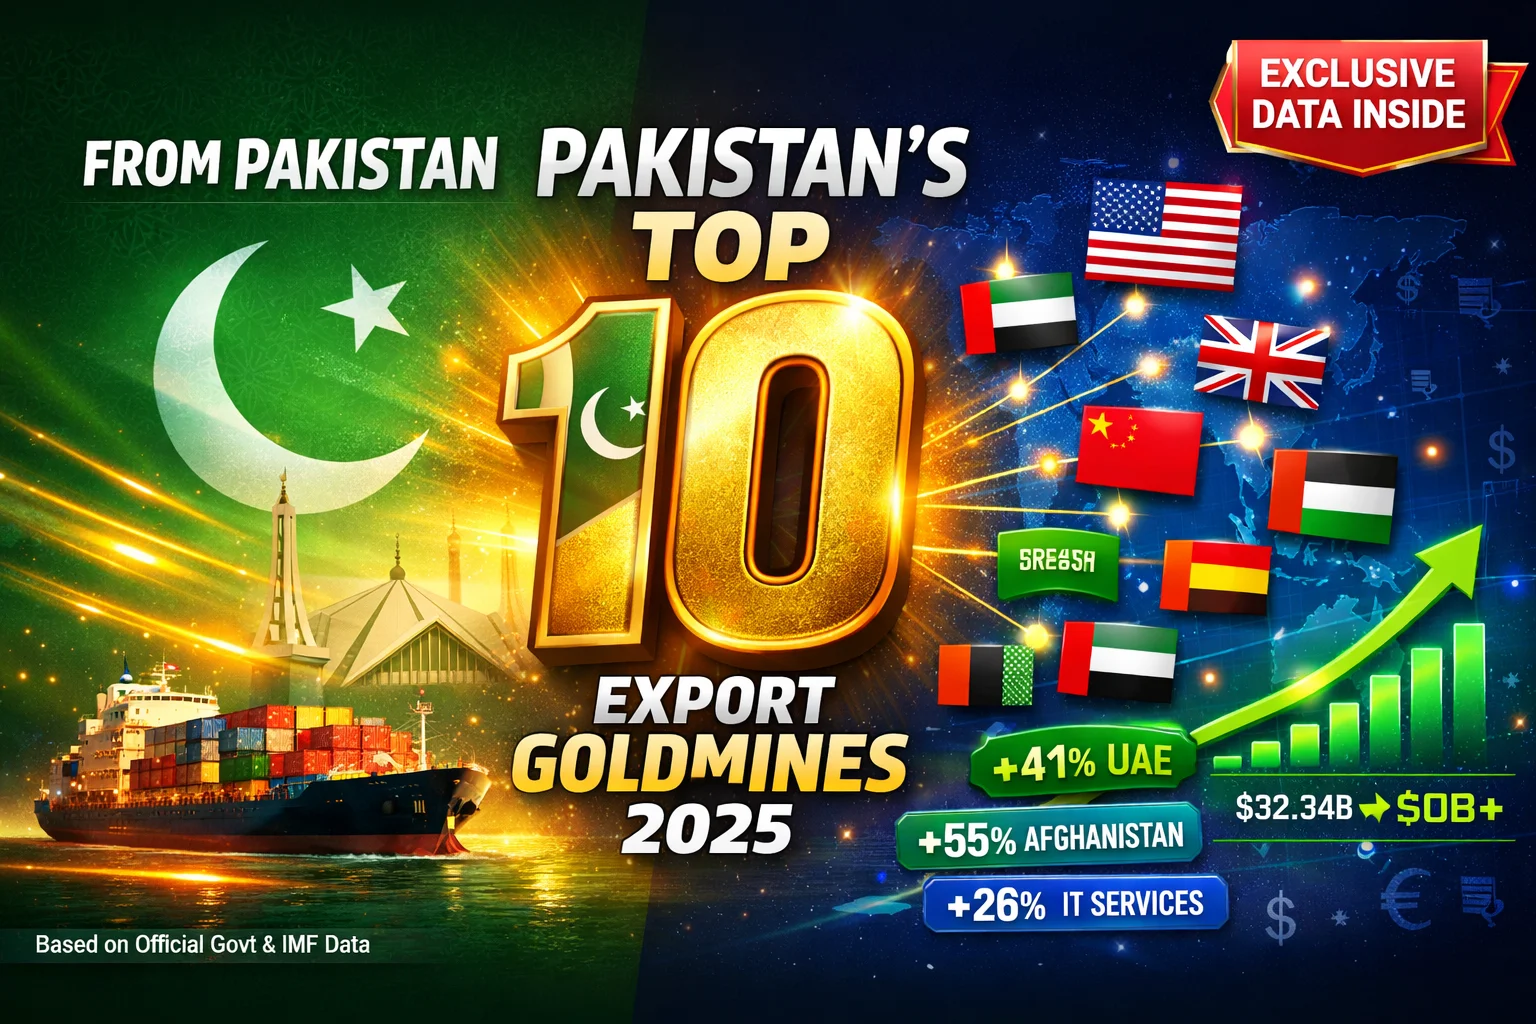
Pakistan’s Export Goldmine: 10 Game-Changing Markets Where Pakistani Businesses Are Winning Big in 2025

Pakistan’s Stock Market Renaissance: How 2025’s Hottest Investment Opportunity Is Democratizing Wealth—A Complete Beginner’s Guide
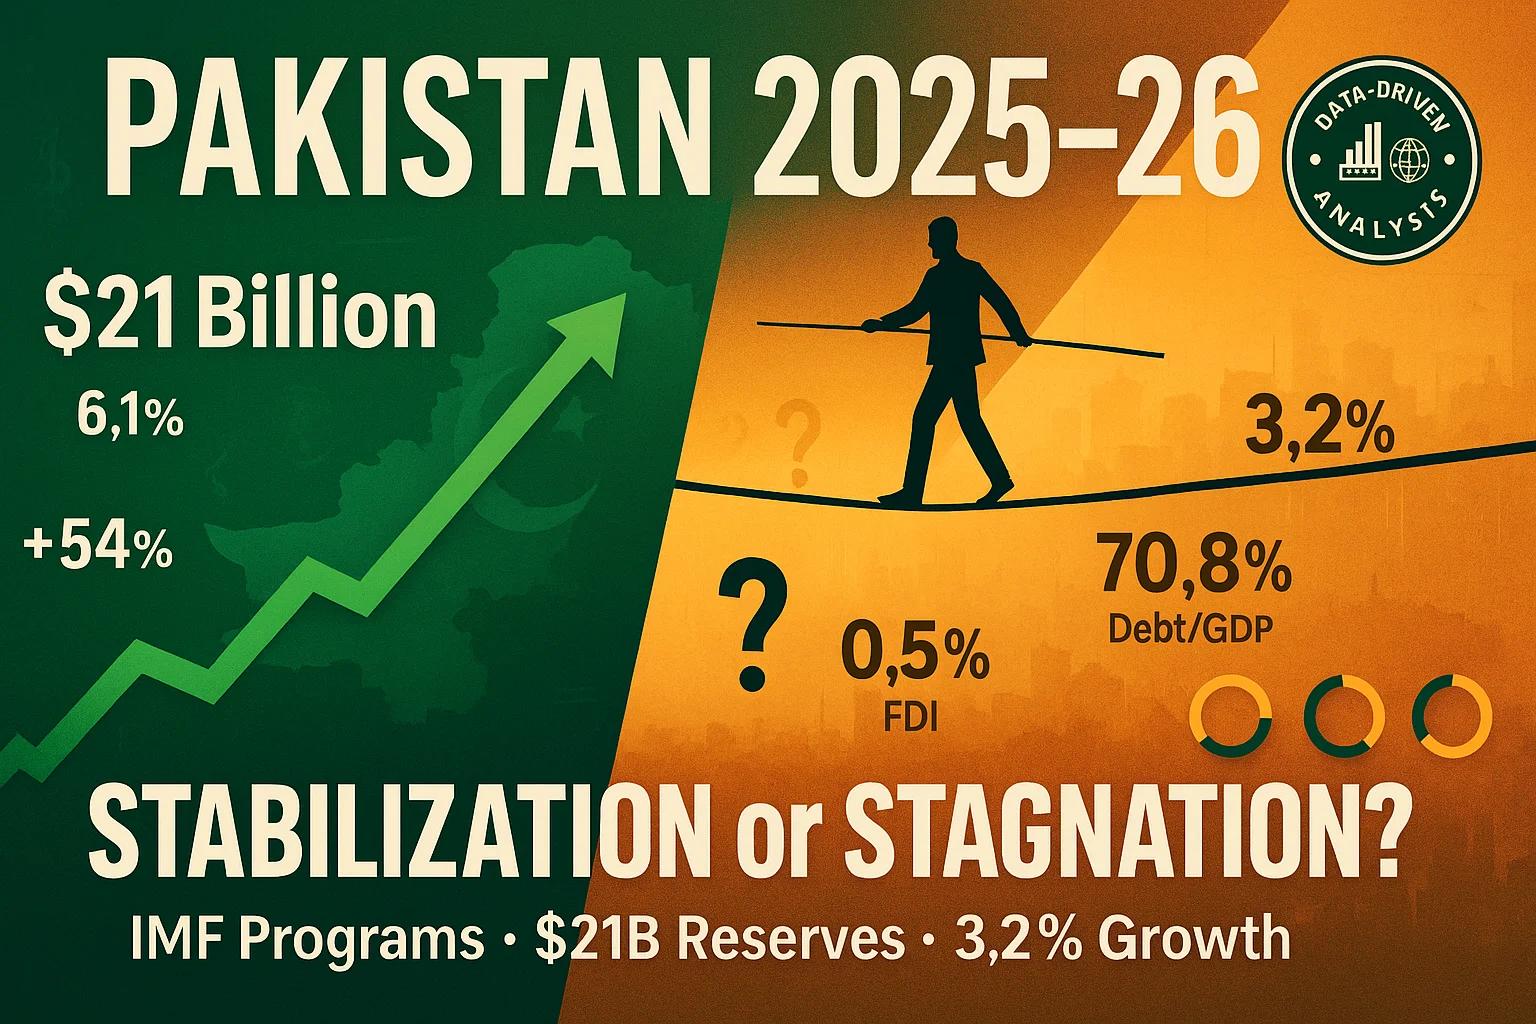
Pakistan’s Economic Outlook 2025: Between Stabilization and the Shadow of Stagnation
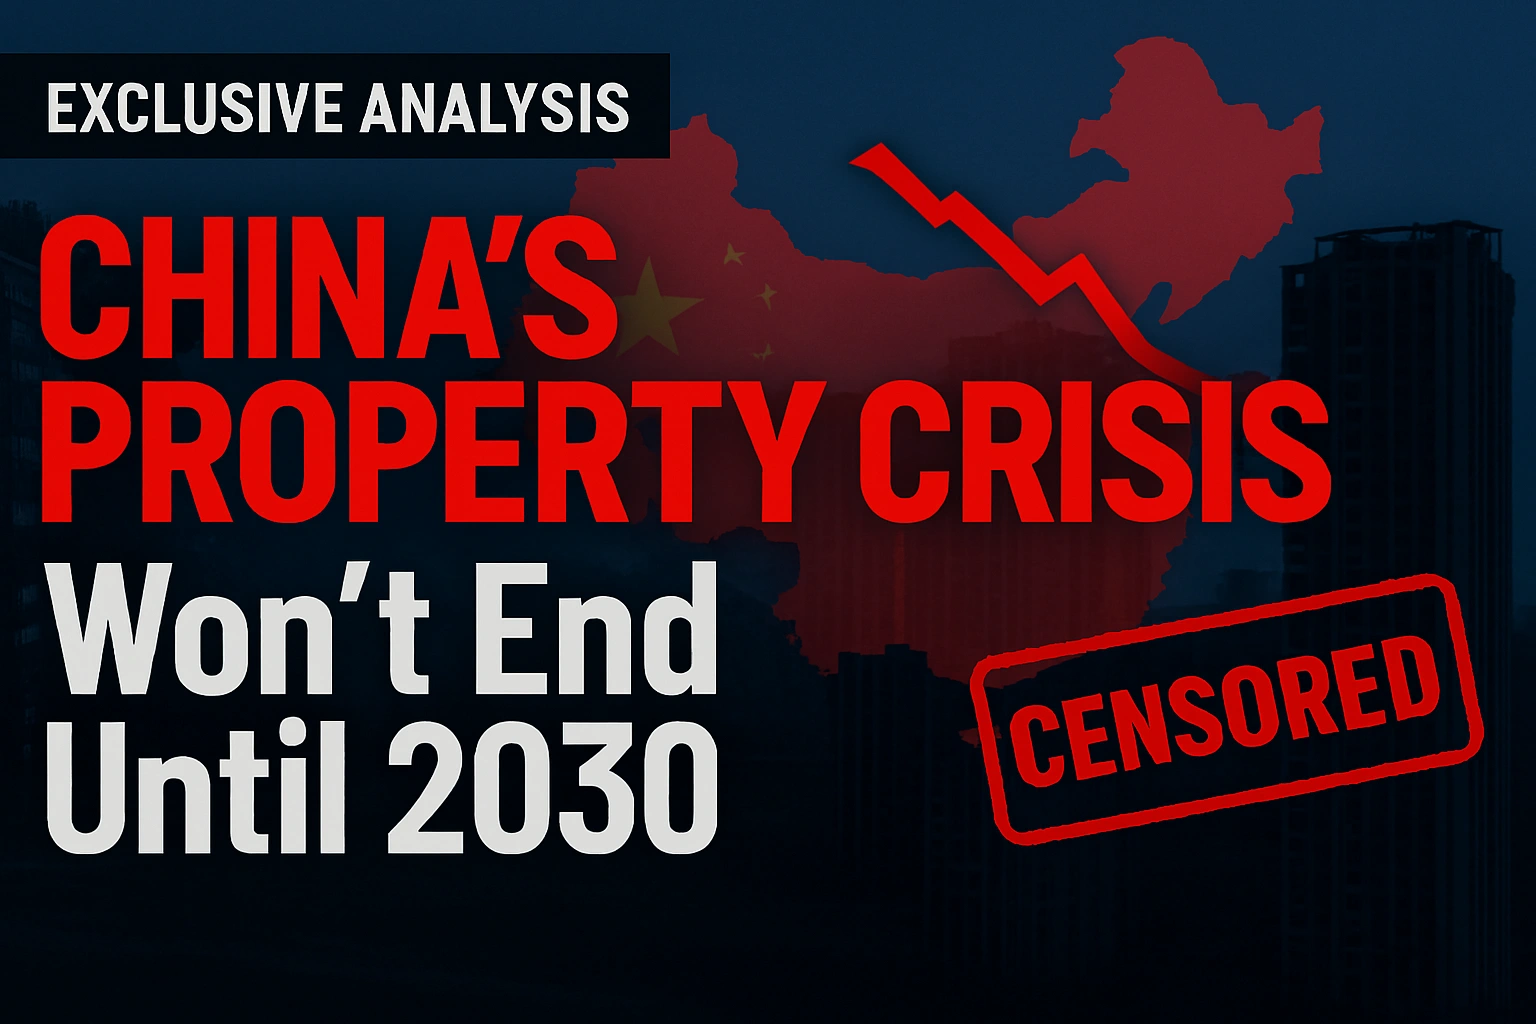
China’s Property Woes Could Last Until 2030—Despite Beijing’s Best Censorship Efforts

The Institutional Era: A Comprehensive Cryptocurrency Investment Analysis for 2026
Real Estate Crash Predictions 2026: Data-Backed Regional Guide

Best Investments in Pakistan 2026: Top 10 Low-Price Shares and Long-Term Picks for the PSX

How to Become an Active Taxpayer on Pakistan’s FBR Active Taxpayer List (ATL) in 2026: A Step-by-Step Guide
DBS Hits S$1 Billion AI Value Milestone — But Agentic AI Poses Talent Challenges for Singapore Banks

The Contours of 21st-Century Geopolitics Will Become Clearer in 2026: A New World Is Starting to Emerge

🌍 Davos 2026: The World Economic Forum Annual Meeting Sets the Stage for Global Transformation
Agentic AI in Finance: How Artificial Intelligence Is Replacing Routine Tasks on Wall Street

AI Impact on Wages 2026: Productivity Soars, Paychecks Stagnate
-
Markets & Finance10 months ago
Top 15 Stocks for Investment in 2026 in PSX: Your Complete Guide to Pakistan’s Best Investment Opportunities
-
Analysis9 months ago
Debunking IMF Program Myths: Reconfiguring Engagement for True National Ownership in a Volatile World
-
Analysis4 months ago
China Economy 2026: Property Crisis, AI Investment & Export Surplus Explained
-
Investment10 months ago
Top 10 Mutual Fund Managers in Pakistan for Investment in 2026: A Comprehensive Guide for Optimal Returns
-
Asia10 months ago
China’s 50% Domestic Equipment Rule: The Semiconductor Mandate Reshaping Global Tech
-
AI10 months ago
15 Most Lucrative Sectors for Investment in Pakistan: A 2025 Data-Driven Analysis
-
Exports10 months ago
Pakistan’s Export Goldmine: 10 Game-Changing Markets Where Pakistani Businesses Are Winning Big in 2025
-
Global Economy10 months ago
Pakistan’s Stock Market Renaissance: How 2025’s Hottest Investment Opportunity Is Democratizing Wealth—A Complete Beginner’s Guide