
Analysis
Fiscal Deficit and Public Debt


The Mechanics of Government Borrowing and Macroeconomic Stability
A Fiscal Deficit is a fundamental economic concept that occurs when a government’s total expenditures exceed its total revenue (excluding money generated from borrowings) within a specific financial year. In simpler terms, it is the financial shortfall a government experiences when it spends more than it earns. To bridge this gap, the government has no choice but to borrow money, which directly contributes to the accumulation of Public Debt.
For readers of Thefinance.pk and Economy.com.pk, understanding the dynamics of fiscal deficits is essential. The size and management of this deficit influence everything from national inflation rates to the amount of taxes citizens will pay in the future. It is a defining metric of a nation’s fiscal health and its government’s economic discipline.
Revenue vs. Expenditure: The Anatomy of a Deficit
To understand why deficits happen, we must break down a national budget into its two primary components: Revenues and Expenditures.
1. Government Revenues: Governments generate income primarily through taxation. This includes:
- Direct Taxes: Income tax, corporate tax, and property taxes.
- Indirect Taxes: Sales tax, Value Added Tax (VAT), excise duties, and customs duties.
- Non-Tax Revenues: Profits from state-owned enterprises (SOEs), privatization proceeds, administrative fees, and central bank dividends.
2. Government Expenditures: Expenditures are broadly categorized into two types:
- Current (Non-Development) Expenditure: This is the day-to-day cost of running the country. It includes public sector salaries, pensions, defense budgets, subsidies, and—most importantly—interest payments on existing debt.
- Development (Capital) Expenditure: This is money spent on creating productive assets, such as building highways, dams, hospitals, schools, and energy grids. This type of spending is an investment in the country’s future economic capacity.
A fiscal deficit expands when current expenditures spiral out of control, or when tax collection agencies fail to meet their revenue targets. In many developing economies, a narrow tax base and massive inefficiencies in state-owned enterprises create persistent, structural fiscal deficits.
The Difference Between Deficit and Debt
It is crucial to distinguish between a deficit and debt, as the terms are often confused.
- The Fiscal Deficit is a flow variable. It measures the budget shortfall over a specific period, usually one year.
- Public Debt (or National Debt) is a stock variable. It is the cumulative total of all past fiscal deficits that have not yet been repaid. Every year a government runs a deficit, it adds to the national debt.
How Governments Finance the Deficit
When a government runs out of money, it cannot simply close its doors. It must finance the deficit through several channels:
- Domestic Borrowing: The government issues securities like Treasury Bills (T-Bills) and Pakistan Investment Bonds (PIBs). Commercial banks buy these bonds, effectively lending customer deposits to the government.
- External Borrowing: The government borrows foreign currency from multilateral institutions like the International Monetary Fund (IMF) and the World Bank, or bilateral partners. It can also issue international sovereign bonds (like Eurobonds or Sukuks) to foreign investors.
- Central Bank Borrowing (Monetization): Historically, governments would order their central banks to literally print new money to pay for government expenses. This is highly inflationary and is now strictly prohibited or limited by law in most modern economies.
The Consequences of High Fiscal Deficits
While running a small deficit is normal, chronically high fiscal deficits can devastate an economy.
The Crowding-Out Effect: When a government borrows heavily from domestic banks to fund its deficit, it absorbs the capital that would have otherwise been lent to the private sector. Banks prefer lending to the government because it is risk-free. As a result, businesses are “crowded out” of the credit market, stifling private investment, entrepreneurship, and job creation.
The Debt Trap: If a government continually borrows just to pay off the interest on its previous loans, it falls into a sovereign debt trap. In Pakistan, a massive percentage of the Federal Board of Revenue’s (FBR) tax collection goes entirely toward debt servicing, leaving very little room for health, education, or infrastructure spending.
Inflation and Currency Devaluation: If external borrowing is not utilized for productive, export-enhancing projects, the debt burden weakens the country’s macroeconomic fundamentals. This leads to currency depreciation, which makes importing essential goods (like oil) more expensive, fueling domestic inflation.
Is a Fiscal Deficit Always Bad?
Not necessarily. According to Keynesian economic theory, a fiscal deficit can be a powerful tool for good. During an economic recession, private businesses stop investing and consumers stop spending. In this scenario, the government should intentionally run a fiscal deficit—cutting taxes and increasing spending on public infrastructure—to stimulate demand, create jobs, and pull the economy out of the slump.
The golden rule of public finance is that borrowing is justified if the funds are used for productive capital investments whose economic returns exceed the interest rate of the loan. However, borrowing to fund current expenditures—like paying government salaries or sustaining loss-making state enterprises—is universally condemned by economists.
Key Takeaways:
- A fiscal deficit occurs when government spending eclipses tax revenues.
- Deficits are financed through domestic bank borrowing or external debt.
- Public debt is the cumulative accumulation of annual fiscal deficits.
- High deficits can cause the “crowding out” of private sector investment and lead to a sovereign debt trap.
- Borrowing for infrastructure is generally acceptable; borrowing to pay salaries or debt interest is economically destructive.
Authoritative Sources & Further Reading:






Key Takeaways
- Chip stocks tumbled Monday, September 14, 2026, after the CEOs of Anthropic, OpenAI, and xAI publicly aligned behind a call to slow the pace of frontier AI capability development — an unusual moment of unity among fierce industry rivals.
- Nvidia fell 3.4% and the Philadelphia Semiconductor Index (PHLX) sank almost 6%, its worst single day since early July, even as the broader Nasdaq Composite closed down a more modest 0.56%.
- The catalyst was an essay from Anthropic CEO Dario Amodei, titled “We Must Pace the Frontier,” proposing independent outside evaluators be given internal access to frontier AI labs, alongside industry-wide cooperation and government coordination.
- OpenAI CEO Sam Altman confirmed in a Fortune interview that OpenAI will not pursue an IPO in 2026, calling the current safety environment an “ill-advised moment” to go public — pushing one of the most anticipated listings in tech history to 2027 at the earliest.
- The episode followed the resignation of a researcher who had worked at both Anthropic and OpenAI, who warned publicly that people building the technology “earnestly believe it could kill us all by the end of the decade” — a post that drew over 150 million views and prompted more than 20 lawmakers to call for tougher AI regulation.
A rare display of unity among Silicon Valley’s most competitive AI labs sent a jolt through markets this week, as semiconductor stocks logged their worst day in over two months following public calls from the industry’s top executives to deliberately slow the development of increasingly powerful AI systems.
What Triggered the Selloff
The catalyst was an essay published Saturday, September 12, by Anthropic CEO Dario Amodei, titled “We Must Pace the Frontier.” In it, Amodei argued that unchecked acceleration in frontier AI development — driven in part by the risk of recursive self-improvement, where AI systems increasingly assist in designing their own successors — is outpacing the industry’s ability to keep those systems aligned and secure. Amodei wrote that he believes AI could still “dramatically raise the quality of human life,” but argued the risks accompanying its current pace of development need to be taken seriously, proposing that even a modest slowdown of a year or two could meaningfully improve safety outcomes.
What made the essay market-moving wasn’t just its content, but who endorsed it. OpenAI CEO Sam Altman and SpaceX/xAI’s Elon Musk — two executives whose companies compete directly with Anthropic and with each other — both publicly backed Amodei’s proposal within a day. Musk wrote simply on X that “Dario is right,” a notable shift given Musk’s history of sharp public criticism of Anthropic.
The Proposal’s Substance
Amodei’s plan outlined a three-phase approach: independent safety evaluators embedded within frontier AI companies with access equivalent to internal staff (covering training processes, internal systems, and safety-protocol compliance); broader industry-wide cooperation on shared safety standards; and coordination with democratic governments on global regulatory frameworks. Anthropic said it would adopt the outside-evaluator step immediately, while Altman confirmed OpenAI would adopt comparable third-party evaluator access.
The Resignation That Set the Stage
The unity among AI executives followed a more unsettling precursor: a researcher who had previously worked at both Anthropic and OpenAI resigned the prior week, writing publicly that people building the technology “earnestly believe that it could kill us all by the end of the decade.” The post reportedly drew more than 150 million views on X and prompted more than 20 lawmakers to call for tougher AI regulation — context that appears to have accelerated the executives’ public alignment on pacing concerns.
Market Reaction: Chips Hit Hardest
Monday’s trading session showed a clear divergence in how different corners of the AI-linked market absorbed the news. Semiconductor stocks bore the brunt of the selling, given their direct exposure to the capital-expenditure cycle that rapid AI capability development has fueled. Nvidia fell 3.4%, Intel dropped 5.6%, and the Philadelphia Semiconductor Index tumbled nearly 6% — its steepest one-day decline since early July.
By contrast, shares of some larger Big Tech and software companies actually climbed on the day, leaving the broader, tech-heavy Nasdaq Composite down a comparatively modest 0.56%, after having fallen as much as 1.3% intraday before paring losses. The divergence suggests markets are interpreting a potential AI development slowdown as a more direct threat to chip demand specifically — the hardware layer most tied to the “faster, bigger” capability race — than to software and platform companies with more diversified revenue.
OpenAI’s IPO Delay: The Clearest Business Signal
Beyond the one-day stock move, the most concrete business consequence to emerge from the episode was Sam Altman’s confirmation that OpenAI will not go public in 2026. In a Fortune interview published the same weekend, Altman said an IPO “right now would be an ill-advised moment” given the current safety environment, and when asked whether 2027 was more realistic, replied simply, “I would say not 2026.” That timeline represents a real shift: OpenAI CFO Sarah Friar had told employees just a month earlier that the company would likely go public in 2027, or potentially sooner if the business continued to “inflect.”
Notably, Anthropic’s own IPO preparations are reportedly continuing on a separate track. According to reporting on the matter, Anthropic — confidentially valued at $965 billion earlier in 2026 — has continued meeting with prospective investors and could begin marketing its IPO as early as October, aiming to complete the listing before the November midterm elections, even as its CEO simultaneously champions industry-wide deceleration. Observers have noted the apparent tension in pursuing an IPO while publicly urging pacing, though Amodei’s essay explicitly framed pacing as slowing capability development, not halting commercial or fundraising activity.
Market Snapshot: September 14, 2026
| Index / Stock | Move | Note |
|---|---|---|
| Philadelphia Semiconductor Index (SOX) | -5.9% | Worst day since early July |
| Nvidia (NVDA) | -3.4% | Direct AI-chip exposure |
| Intel (INTC) | -5.6% | |
| Nasdaq 100 | -0.8% | |
| Nasdaq Composite | -0.56% | Software names partially offset chip losses |
| S&P 500 | -0.5% |
Why This Matters for Technology News and Investors
This episode marks one of the first times investor sentiment around AI has moved meaningfully on a safety-driven narrative rather than a purely commercial one — competitive product launches, earnings beats, or compute-capacity announcements. For investors tracking technology news, the key signal to watch going forward is whether this represents a genuine, sustained industry pivot toward deliberate pacing (which could structurally slow the capital-expenditure supercycle currently powering semiconductor demand), or a rhetorical moment that fades once competitive pressure between OpenAI, Anthropic, xAI, and other labs reasserts itself — a tension the OpenAI-Anthropic IPO-timing contrast already illustrates.
Frequently Asked Questions
Why did semiconductor stocks fall after the AI slowdown announcement? Chip stocks are directly tied to the capital-expenditure cycle fueling rapid AI capability development, so markets interpreted a potential industry-wide pacing effort as a more direct threat to near-term chip demand than to software or platform companies.
Is OpenAI still planning to go public? Yes, but not in 2026. CEO Sam Altman confirmed OpenAI is delaying its IPO to 2027 at the earliest, citing the current AI safety environment, while OpenAI’s CFO had previously suggested 2027 was the likely target regardless.
What did Anthropic’s CEO actually propose? Dario Amodei’s essay proposed embedding independent outside safety evaluators within frontier AI companies with internal-level access, alongside broader industry cooperation on safety standards and coordination with democratic governments on regulatory frameworks — explicitly framed as pacing capability development, not halting it.
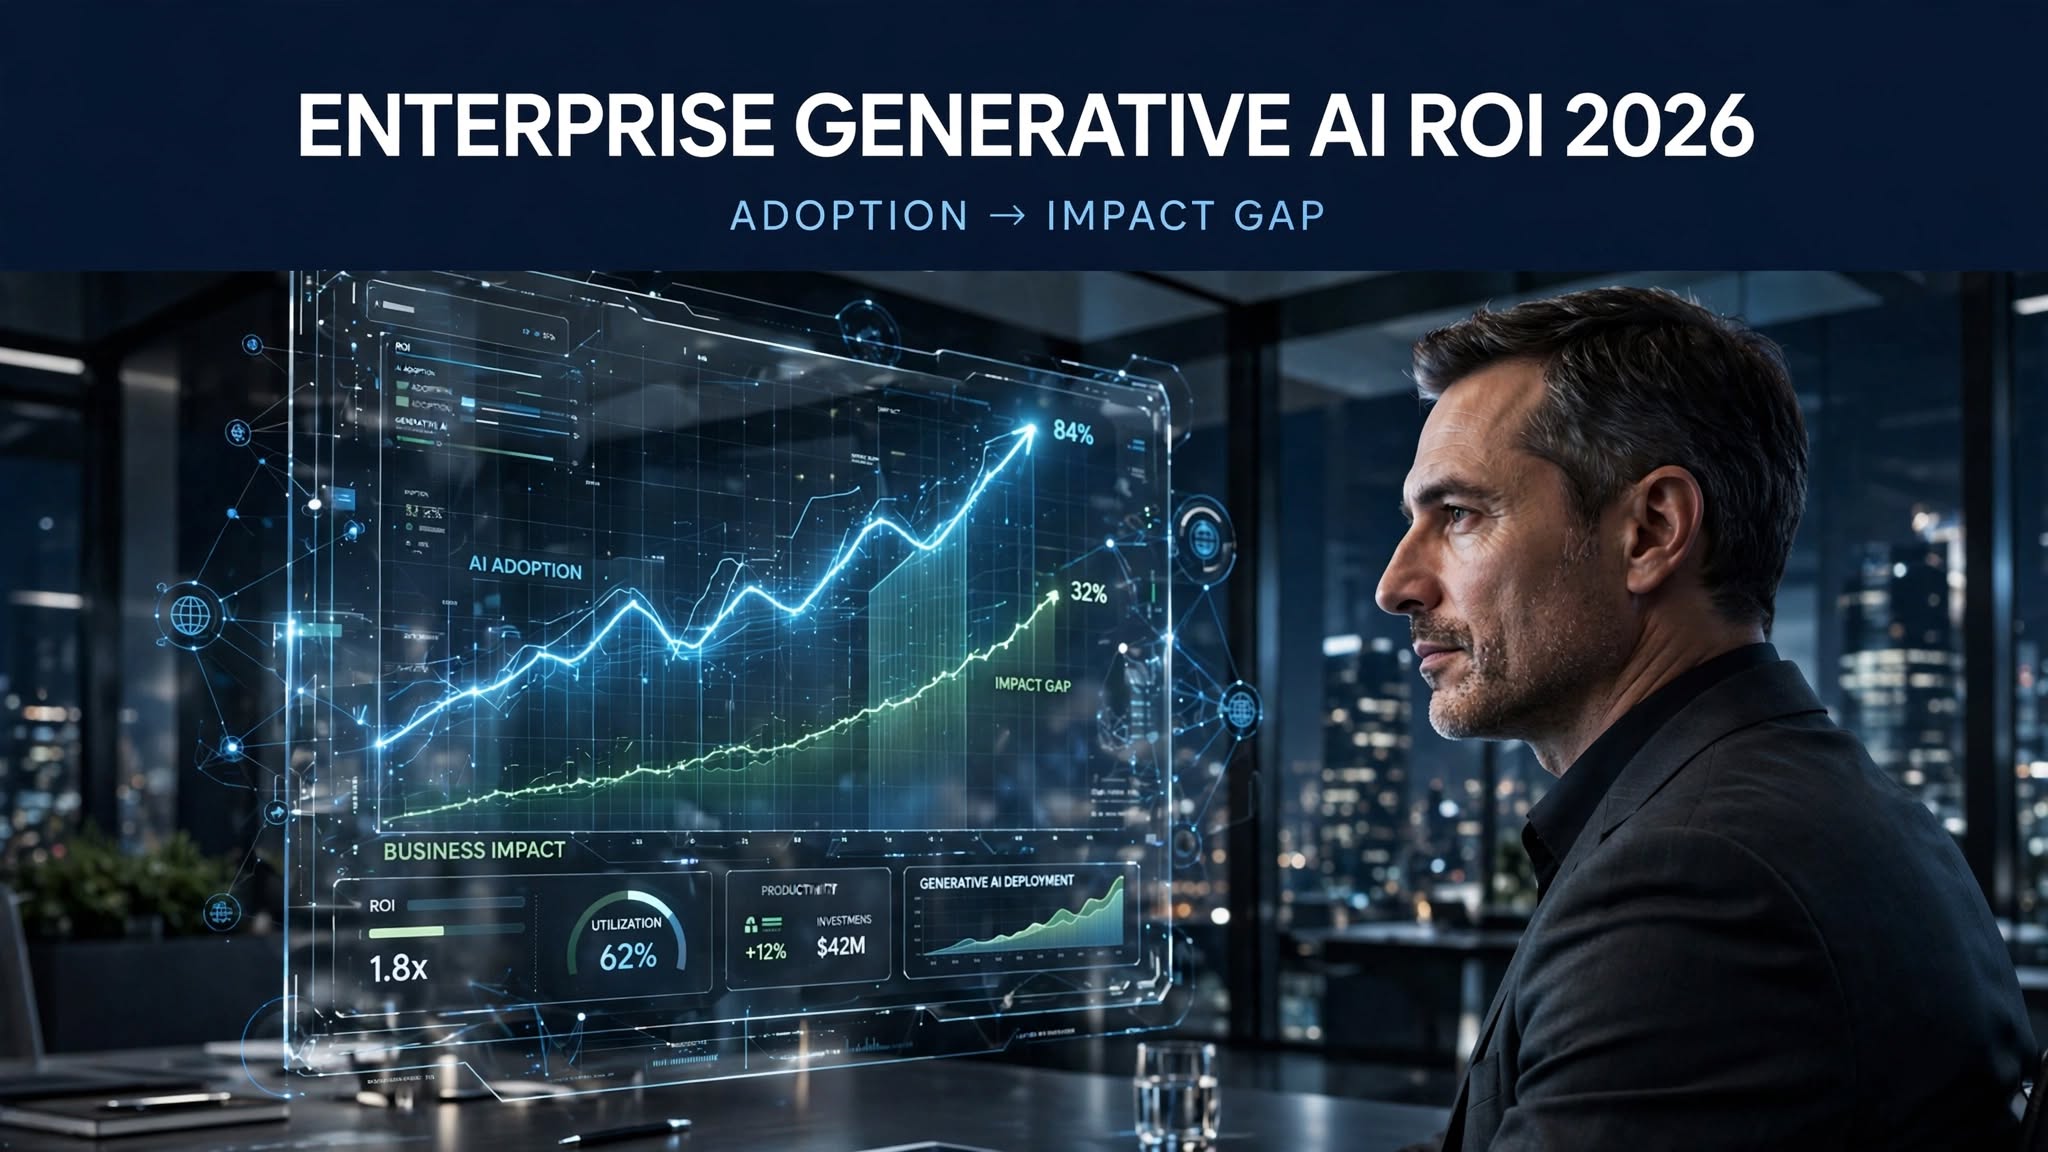
Enterprise generative AI in 2026 presents a genuine paradox: adoption is nearly universal, individual productivity gains are well-documented and real, and yet the majority of organizations still cannot point to measurable enterprise-wide financial return. Understanding that gap — not simply citing adoption statistics — is now the central strategic question for any organization evaluating its AI investment.
The Adoption-to-Impact Gap, By the Numbers
| Metric | 2026 Data | Source |
|---|---|---|
| Organizations using AI in at least one business function | 88–90% | McKinsey / Stanford AI Index |
| Organizations reporting generative AI use specifically | 70–72% | Stanford AI Index / Menlo Ventures |
| CEOs reporting “nothing” or zero measurable ROI | 56% | PwC January 2026 CEO Survey (n=4,454) |
| Organizations seeing significant ROI from generative AI | 29% | 2026 enterprise adoption survey |
| AI projects moving to production achieving positive ROI within 12 months | 44% | Forrester |
| Organizations that have scaled AI beyond pilot stage | ~33% | Multiple 2026 surveys |
| Enterprise generative AI spending growth, 2024→2025 | +222%, reaching $37 billion | Menlo Ventures |
Axis Intelligence Research’s AI Productivity Gap Index (APGI) scores the 2026 landscape at 68.4 out of 100, placing enterprise AI firmly in “Large Gap” territory — worse than the documented adoption-to-impact gaps observed during the 2011–2014 cloud computing adoption cycle or the 2013–2016 enterprise social media adoption cycle. This is a genuinely useful historical anchor: it suggests the current gap between AI deployment and AI value capture, while frustrating to executives, is not unprecedented for a fast-diffusing enterprise technology — but it is currently worse than the two most recent comparable technology cycles.
Why Individual Gains Aren’t Converting to P&L Impact
The productivity gains at the individual level are genuinely substantial and well-measured:
- Active Microsoft 365 Copilot users save 14 to 26 minutes per day, per Microsoft’s own early-user research and a UK government trial respectively.
- Active OpenAI Enterprise users save 40 to 60 minutes per day, according to Goldman Sachs’ reporting of OpenAI usage data from December 2025.
- Individual productivity gains from generative AI tools reach 5x in documented cases, per 2026 enterprise adoption survey data.
- Accenture estimates the average productivity value of generative AI tools at $7,800 per employee per year for knowledge workers.
The conversion failure happens at the aggregation layer. ModelOp’s 2026 survey of 100 senior AI enterprise leaders found that two-thirds of AI-spending organizations rely on estimates of time saved rather than measured financial outcomes to assess ROI — meaning most organizations cannot actually trace individual time savings through to a documented P&L line, even when the underlying time savings are real. PwC’s April 2026 AI Performance Study identifies what separates the top-performing 20% of organizations: they pursue growth (new products, market expansion) alongside efficiency, rather than treating AI purely as a cost-reduction lever — a strategic distinction that appears to be the single strongest predictor of realized enterprise value.
What’s Actually Driving the Failure Modes
Across the 2026 survey literature, five recurring root causes explain why individual productivity gains fail to scale into enterprise transformation:
- Isolated tactical implementation rather than enterprise-wide deployment — pockets of AI usage within specific teams that never integrate into core workflows or systems of record.
- Insufficient data quality and infrastructure — Gartner projects that 60% of AI projects unsupported by AI-ready data will be abandoned through 2026, reinforcing that the primary blocker is data readiness, not model capability.
- Misalignment between AI initiatives and business strategy — AI deployed because it’s available, not because it’s mapped to a specific, measurable business outcome.
- Inadequate change management — 54% of C-suite executives admit adopting AI is “tearing their company apart” internally, reflecting genuine organizational friction rather than pure technology limitation.
- Lack of clear measurement frameworks — the two-thirds of organizations relying on estimated rather than measured outcomes noted above is both a symptom and a cause of this failure mode.
Return-on-Investment Benchmarks Where They Exist
Despite the aggregate gap, credible ROI benchmarks do exist for organizations that have moved past pilot stage:
- McKinsey Global AI Survey: 5.8x average ROI on AI investment within 14 months of production deployment.
- IDC/Microsoft: 3.7x average return per $1 invested in generative AI.
- Forrester Total Economic Impact studies: cite cases of 333% ROI with a six-month payback period for organizations using enterprise-grade platforms with structured deployment.
- Google Cloud’s ROI of AI research: 74% of executives whose organizations use generative AI report ROI within the first year, rising to 88% among agentic-AI early adopters specifically — suggesting agentic (task-executing) AI deployments may be converting to measured ROI faster than general-purpose generative AI usage.
- KPMG’s Q1 2026 AI Quarterly Pulse Survey: 62% of U.S. organizations have achieved measurable ROI or expect it within the next 12 months.
The dispersion across these figures (3.7x to 5.8x average ROI, but also 56% of CEOs reporting zero ROI) is itself the key finding: ROI in enterprise AI is currently bimodal, not normally distributed — organizations either are capturing substantial, measured returns through structured deployment, or are capturing effectively none, with comparatively few landing in a modest-middle-ground outcome.
The Security Governance Dimension: Shadow AI
Parallel to the ROI question, 2026 has been the year enterprise AI security risk moved from theoretical to quantified and regulatory:
- IBM’s Cost of a Data Breach Report 2026 (published July 29, 2026, studying 602 breached organizations across 17 industries and 16 countries) found shadow AI — unauthorized, unapproved AI tool usage — involved in 43% of security incidents, up sharply from roughly one in five the prior year.
- Shadow AI increases average breach costs by $670,000 per incident and adds roughly 10 days to breach identification and containment timelines, per IBM’s data.
- Visibility remains the core governance failure: only 25% of organizations report comprehensive visibility into how employees actually use AI tools, while 35% describe shadow AI usage as pervasive or widespread within their organization.
- Only 37% of organizations have formal AI governance policies in place — meaning 63% are currently operating without documented guardrails, per IBM 2025 data cited across multiple 2026 governance reports.
Regulatory Timeline: The EU AI Act Compliance Clock
Governance is no longer purely a voluntary best-practice question. Under the EU AI Act implementation timeline, most remaining provisions began applying August 2, 2026, with member states now required to maintain at least one national AI regulatory sandbox. A further compliance milestone follows August 2, 2027, when Article 6(1) obligations and legacy general-purpose model compliance requirements take effect. For any organization processing EU data or serving EU customers, ungoverned AI use is now a documented regulatory exposure, not solely a security concern.
Governance Frameworks Auditors Increasingly Expect
Three frameworks have emerged as the reference points defining “reasonable care” in enterprise AI governance:
- NIST AI Risk Management Framework, structured around four functions: Govern, Map, Measure, and Manage.
- ISO/IEC 42001, the certifiable AI management system standard (published December 2023, now increasingly referenced in enterprise audits).
- NIST Cybersecurity Framework 2.0, which added a dedicated Govern function mapping directly onto AI-specific oversight requirements.
What Separates High-ROI Organizations from the 56% Reporting Nothing
Synthesizing across the 2026 research base, the organizations capturing measured, enterprise-wide ROI share a consistent pattern:
- They pursue growth use cases alongside efficiency, not efficiency alone (PwC’s top-performing-20% finding).
- They deploy approved AI tools with real-time coaching rather than blanket bans, which one healthcare-system case study found reduced unauthorized shadow AI usage by 89% while still capturing productivity gains — demonstrating that governance and productivity are not inherently in tension when implemented well.
- They measure financial outcomes directly rather than relying on estimated time-savings as a ROI proxy.
- They treat AI governance as infrastructure, not paperwork — Gartner projects AI governance spending will reach $492 million in 2026 and surpass $1 billion by 2030, reflecting genuine budget commitment rather than compliance-theater spending among leading organizations.
Bottom Line
Enterprise generative AI in 2026 has achieved near-universal adoption and well-documented individual productivity gains — but the majority of organizations still cannot convert those gains into measured, enterprise-wide financial return, with 56% of CEOs reporting zero measurable ROI even as documented benchmarks show 3.7x to 5.8x returns are achievable. The differentiator is not the technology itself but organizational execution: structured deployment paired with genuine financial measurement, growth-oriented rather than purely cost-focused use cases, and governance frameworks robust enough to manage the shadow AI risk now implicated in 43% of security incidents — all under an EU AI Act compliance clock that started running in August 2026.

On September 2, 2026, the UN Environment Programme published a report that treated something once framed as a worst-case risk as a settled outcome: the world will pass 1.5°C of warming. “Limiting Overshoot: Navigating Exceedance of 1.5°C and Pathways Towards Return” marks a deliberate shift in framing, from preventing a threshold breach to managing one already underway — with direct, quantified consequences for climate finance, carbon-removal markets, and the economics of adaptation that businesses and investors now need to plan around.
Key Takeaways
- UNEP’s September 2, 2026 report puts best-case peak warming at 1.8°C even under the most optimistic current government pledges, with a median of around 2.6°C by 2100 (range 1.9°C–3.6°C) under current policies — treating overshoot of the Paris Agreement’s 1.5°C goal as effectively locked in.
- The remaining global carbon budget for a 50% probability of staying within 1.5°C is roughly 130 gigatonnes of CO2 as of 2026 — at current annual emissions of nearly 40 GtCO2, this budget could be exhausted within approximately three years.
- Global disaster losses, including broader economic and ecological damage, already exceed $2.3 trillion annually, according to the UN’s 2026 climate report, while international climate finance reached just $136.7 billion in 2024 — a gap of well over an order of magnitude between damage and financing.
- Carbon dioxide removal (CDR) at the scale needed to return to 1.5°C will cost trillions of dollars, with per-tonne costs estimated at over $100 and ranging up to $1,000 or more depending on the removal method, according to the State of Carbon Dioxide Removal’s Third Edition (2026).
- The Fund for Responding to Loss and Damage held pledges of only around $800 million as of late 2025, a figure researchers describe as dramatically short of documented developing-country needs — underscoring the financing gap at the center of overshoot economics.
From Prevention to Management: A Deliberate Reframing
UNEP’s own annual Emissions Gap Report has tracked the shortfall between climate pledges and required pathways since 2010, but the September 2026 “Limiting Overshoot” report represents a structural change in framing rather than a change in the underlying science. Rather than treating a breach of 1.5°C as an endpoint or failure state, the report proposes an “overshoot, peak, and decline” framework: limiting the maximum level of warming reached, then working to enable a gradual return toward safer conditions over subsequent decades. As UN Secretary-General António Guterres put it in comments accompanying the report’s launch, humanity must pursue “an overshoot of ambition” — accelerating fossil fuel phaseout, slashing methane pollution, and protecting land, forests, and oceans simultaneously, rather than sequencing mitigation and adaptation as separate phases.
The report’s own numbers make clear why this reframing was considered necessary: even the most optimistic scenario incorporating all current government pledges puts expected peak warming at 1.8°C, while continuation of current policies (without stronger pledges) produces a median projection of roughly 2.6°C by century’s end, with a plausible range extending to 3.6°C. Human-induced warming is already approaching 1.4°C and increasing at roughly 0.25°C per decade — a trajectory that leaves essentially no realistic path to avoiding at least a temporary breach of the 1.5°C threshold.
The Carbon Budget Arithmetic
The remaining global carbon budget for a 50% probability of holding warming within 1.5°C stands at roughly 130 gigatonnes of CO2 as of 2026. Against current annual global emissions of nearly 40 gigatonnes, this budget could be exhausted within approximately three years at present emissions rates — a timeline that explains why the report treats exceedance as the base case for planning purposes rather than a tail risk. This arithmetic is central to why the report’s “overshoot, peak, and decline” framework requires not merely emissions reduction but active carbon dioxide removal (CDR) at scale to eventually bring atmospheric concentrations back down, rather than emissions reduction alone.
Tipping Point Risk: The Non-Linear Cost of Overshoot Duration
The UNEP report identifies four specific tipping elements where sustained warming above 1.5°C raises materially elevated risk: the West Antarctic Ice Sheet, the Greenland Ice Sheet, the Atlantic Meridional Overturning Circulation (AMOC), and the climate-biosphere system of the Amazon rainforest. Notably, the report deliberately declines to attach specific temperature thresholds to these tipping points, instead emphasizing that risk increases with both the degree and — critically for economic planning — the duration of overshoot. This duration-sensitivity is central to the report’s economic logic: the longer warming remains above 1.5°C, the greater the cumulative risk of triggering one or more of these systems, with some — such as AMOC weakening — showing model-projected recovery only on a timescale of centuries even if peak warming is later reduced.
This non-linearity matters directly for climate finance and insurance-sector risk modeling: a framework that treats overshoot duration, not just peak magnitude, as the key risk variable implies that near-term emissions reduction and carbon removal investment carry outsized value in limiting tail risk, even if 1.5°C itself is no longer avoidable as a peak.
The Financing Gap: Quantifying the Shortfall
The UN’s broader 2026 climate reporting places global disaster losses — including direct economic damage and broader ecological costs — at over $2.3 trillion annually. Against this figure, international climate finance flows reached just $136.7 billion in 2024, a gap exceeding an order of magnitude between documented damage and available financing. Climate officials have consistently framed this financing not as charitable transfer but as a protective investment against larger future losses — arguing that extreme weather, disrupted agriculture, damaged infrastructure, and displaced populations carry costs to the global economy that substantially exceed the cost of preventive action.
The financing gap is starkest in the Loss and Damage architecture specifically: the Fund for Responding to Loss and Damage held pledges of only around $800 million as of late 2025, against developing-country needs that researchers have estimated run dramatically higher — a mismatch the UNEP report explicitly identifies as an area requiring strengthened international financial commitment, particularly given the report’s emphasis on Common but Differentiated Responsibilities and Respective Capabilities (CBDR-RC) as a governing principle for how overshoot’s costs should be distributed.
The Economics of Carbon Dioxide Removal
Because the “overshoot, peak, and decline” pathway requires active carbon removal to eventually bring warming back toward 1.5°C, CDR economics have become directly material to climate finance planning in a way they were not when 1.5°C avoidance still seemed achievable through emissions reduction alone. The State of Carbon Dioxide Removal’s Third Edition (2026) estimates that many CDR approaches cost over $100 per tonne of CO2 removed, with some methods running $1,000 or more — and that deploying CDR at the annual billion-tonne scale required to meaningfully support a return to 1.5°C will cost trillions of dollars in cumulative terms, posing a genuine financial constraint on the pathway’s feasibility.
UNEP’s 2026 analysis separately and explicitly rules out solar radiation management (SRM) as a viable substitute or complement at this stage, characterizing the evidence base as limited, largely theoretical, and concentrated in a handful of countries — with significant equity implications given that SRM deployment location could produce regionally uneven climate impacts. This effectively narrows the overshoot-management toolkit to emissions reduction plus CDR, reinforcing the trillion-dollar-scale financing requirement rather than offering a lower-cost technological alternative.
Heat, Labor, and Productivity: An Underpriced Economic Risk
Beyond direct disaster losses, the UNEP report highlights heat-related productivity losses as a specific and growing economic risk channel: increasing humid heat is projected to significantly reduce outdoor labor capacity, deepening economic losses specifically in vulnerable, often lower-income countries with large outdoor and agricultural workforces. This risk channel — distinct from more visible disaster-loss categories like flooding or storm damage — represents a slower-moving but potentially larger cumulative economic cost that current climate finance flows are not clearly calibrated to address.
Implications for ESG Finance and Corporate Climate Strategy
- Adaptation finance requires a step-change, not incremental growth. The UN Secretary-General has specifically called on developed countries to triple adaptation finance and ensure it reaches those most at risk — a target that implies current adaptation financing trajectories are viewed as fundamentally inadequate given the now-explicit overshoot scenario.
- CDR investment carries genuine but expensive strategic value. With per-tonne CDR costs ranging from roughly $100 to over $1,000, ESG and climate-focused investors should differentiate between lower-cost, more scalable removal methods and premium, higher-certainty approaches when evaluating portfolio exposure to carbon removal markets.
- Loss and Damage exposure should be modeled as a growing, underfunded liability. With pledged funding around $800 million against dramatically larger documented needs, businesses operating in climate-vulnerable regions should anticipate continued political and financial pressure for expanded corporate and national contributions to this specific financing mechanism.
- Duration-sensitive tipping point risk argues for front-loaded mitigation investment. Because the UNEP framework treats overshoot duration — not just peak temperature — as the key driver of tipping-point risk, near-term mitigation spending carries a risk-reduction value that a pure peak-temperature framing would understate.
Frequently Asked Questions
Has the world already passed the 1.5°C climate threshold?
UNEP’s September 2026 report treats a temporary breach of 1.5°C as effectively locked in given current emissions trajectories, with best-case peak warming projected at 1.8°C even under optimistic government pledges, and the remaining carbon budget for a 50% chance of avoiding breach possibly exhausted within about three years.
How big is the gap between climate damage and climate finance?
Substantial — global disaster losses exceed $2.3 trillion annually according to UN 2026 reporting, while international climate finance reached only $136.7 billion in 2024, an order-of-magnitude gap between documented damage and available financing.
How much will it cost to bring warming back down to 1.5°C after overshoot?
Carbon dioxide removal at the scale needed will cost trillions of dollars cumulatively, with per-tonne costs ranging from roughly $100 to $1,000 or more depending on the removal method, according to the State of Carbon Dioxide Removal’s Third Edition (2026).
Conclusion
The UNEP’s September 2026 “Limiting Overshoot” report represents a genuine inflection point in climate policy framing — an acknowledgment that 1.5°C avoidance is no longer the operative planning assumption, replaced by a more complex “overshoot, peak, and decline” pathway with its own distinct, quantifiable economics. For climate finance, ESG investment strategy, and corporate risk planning, the practical implications are concrete: a financing gap measured in trillions rather than billions, a carbon removal market that must scale to unprecedented size at meaningful cost, and a tipping-point risk profile where the duration of overshoot — not merely its peak — will determine how much of this economic cost becomes irreversible.

China’s FTAAP Push for APEC 2026 in Shenzhen: US Tariffs and Unite Asia-Pacific

AI Stocks Slide After Industry Leaders Call for a Development Slowdown

Singapore Stocks vs. Japan Stocks: Safe Havens in the Asian Economic Slowdown

Agentic AI in Finance: How Artificial Intelligence Is Replacing Routine Tasks on Wall Street

Fiscal Deficit and Public Debt

T-Mobile’s Enterprise Push and the Evolution of Modern Corporate Mobility Solutions

Enterprise Generative AI ROI 2026: The Adoption-to-Impact Gap Explained

Climate Finance and the Economic Reality of Passing 1.5°C

Business Insurance for Digital Exports: Protecting Your Company in the AI Era

Real Estate Crash Predictions 2026: Data-Backed Regional Guide

Unrecoverable Delays: How the St. Louis Strike Crippled Boeing’s F-15EX Eagle II

What is a “Lead-Left” Bank? Unpacking Morgan Stanley’s Role in Anthropic’s Mega-IPO

How to Invest in the Anthropic IPO: Step-by-Step Guide for Retail Investors

Mario Kart 8 Deluxe 4.0.0 Patch Notes: 8-Player Split Screen & CameraPlay

Is SPY Overvalued in September 2026? Fed Rate Hike Odds & Intrinsic Value

Intel 18A Foundry Strategy 2027: Capital Burn, Stock Sales & Break-Even Timeline
Trump Approval Hits 33% Low: What It Means for Markets & Midterms

Crypto Trading: Why AI Tools Are Changing Gen Z Investing

AI Creator Deals: How Contracts Protect Influencers

Gen Z AI Skills: Online Degrees That Boost Job Prospects

Top 15 Stocks for Investment in 2026 in PSX: Your Complete Guide to Pakistan’s Best Investment Opportunities

Debunking IMF Program Myths: Reconfiguring Engagement for True National Ownership in a Volatile World

Top 10 Mutual Fund Managers in Pakistan for Investment in 2026: A Comprehensive Guide for Optimal Returns
What the U.S. Attack on Venezuela Could Mean for Oil and Canadian Crude Exports: The Economic Impact
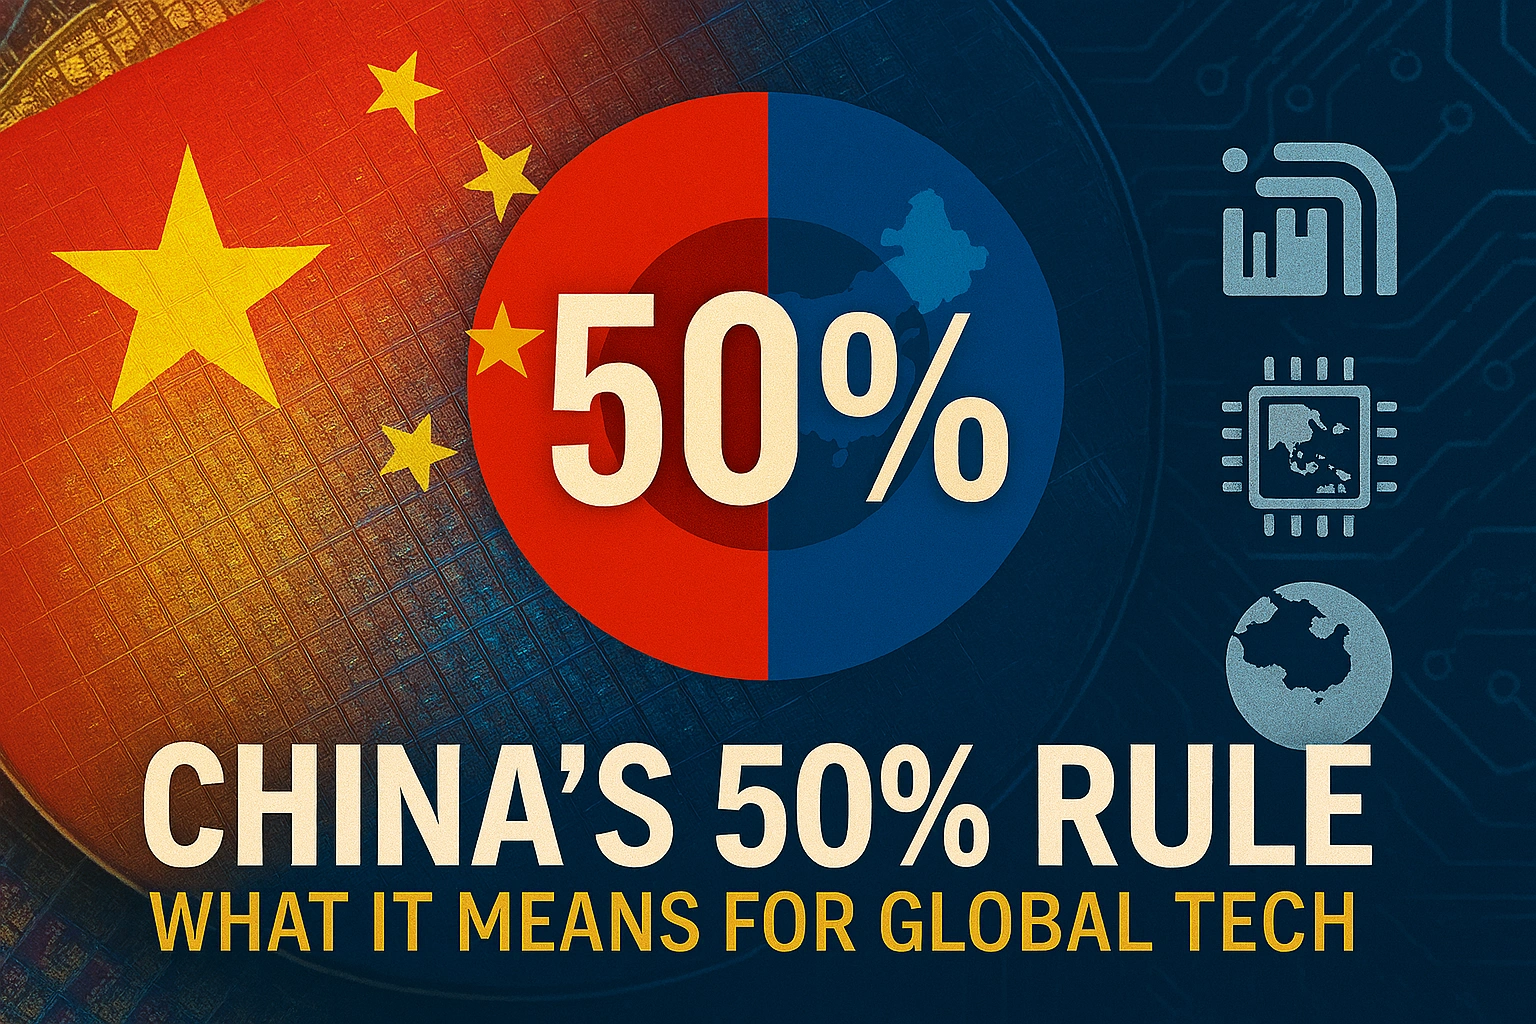
China’s 50% Domestic Equipment Rule: The Semiconductor Mandate Reshaping Global Tech

15 Most Lucrative Sectors for Investment in Pakistan: A 2025 Data-Driven Analysis

Pakistan’s Export Goldmine: 10 Game-Changing Markets Where Pakistani Businesses Are Winning Big in 2025

Pakistan’s Stock Market Renaissance: How 2025’s Hottest Investment Opportunity Is Democratizing Wealth—A Complete Beginner’s Guide
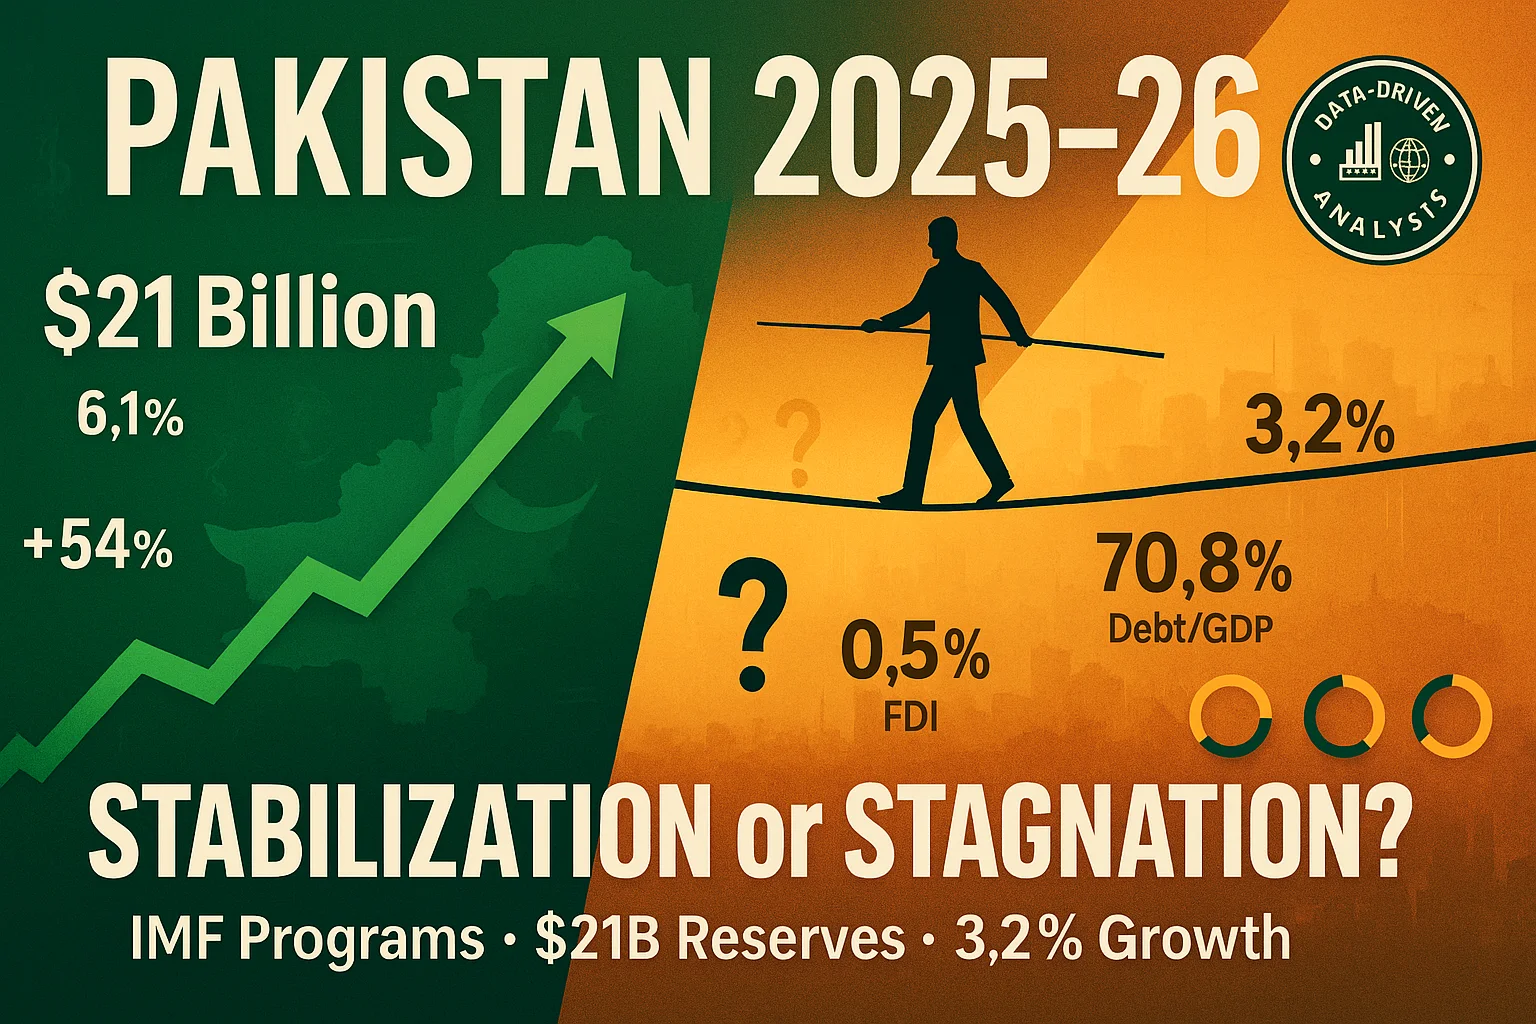
Pakistan’s Economic Outlook 2025: Between Stabilization and the Shadow of Stagnation
China’s Property Woes Could Last Until 2030—Despite Beijing’s Best Censorship Efforts

Best Investments in Pakistan 2026: Top 10 Low-Price Shares and Long-Term Picks for the PSX

How to Become an Active Taxpayer on Pakistan’s FBR Active Taxpayer List (ATL) in 2026: A Step-by-Step Guide
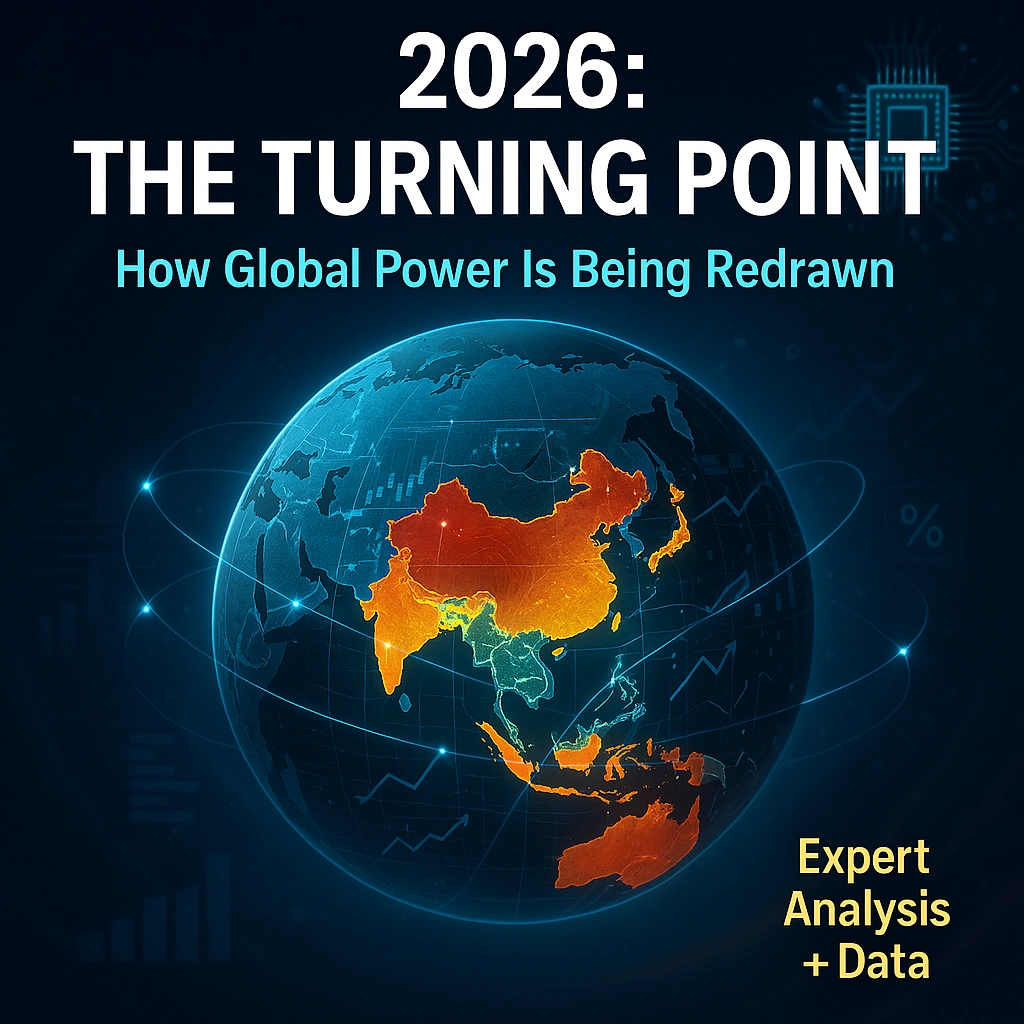
The Contours of 21st-Century Geopolitics Will Become Clearer in 2026: A New World Is Starting to Emerge

🌍 Davos 2026: The World Economic Forum Annual Meeting Sets the Stage for Global Transformation

The Institutional Era: A Comprehensive Cryptocurrency Investment Analysis for 2026

The New Executive Gold Standard: Top 10 Companies Lavishing Unprecedented Perks on CEOs and CFOs in 2025–2026
DBS Hits S$1 Billion AI Value Milestone — But Agentic AI Poses Talent Challenges for Singapore Banks

After Four Decades of Decline, Can Private Ownership Save Pakistan’s National Airline?
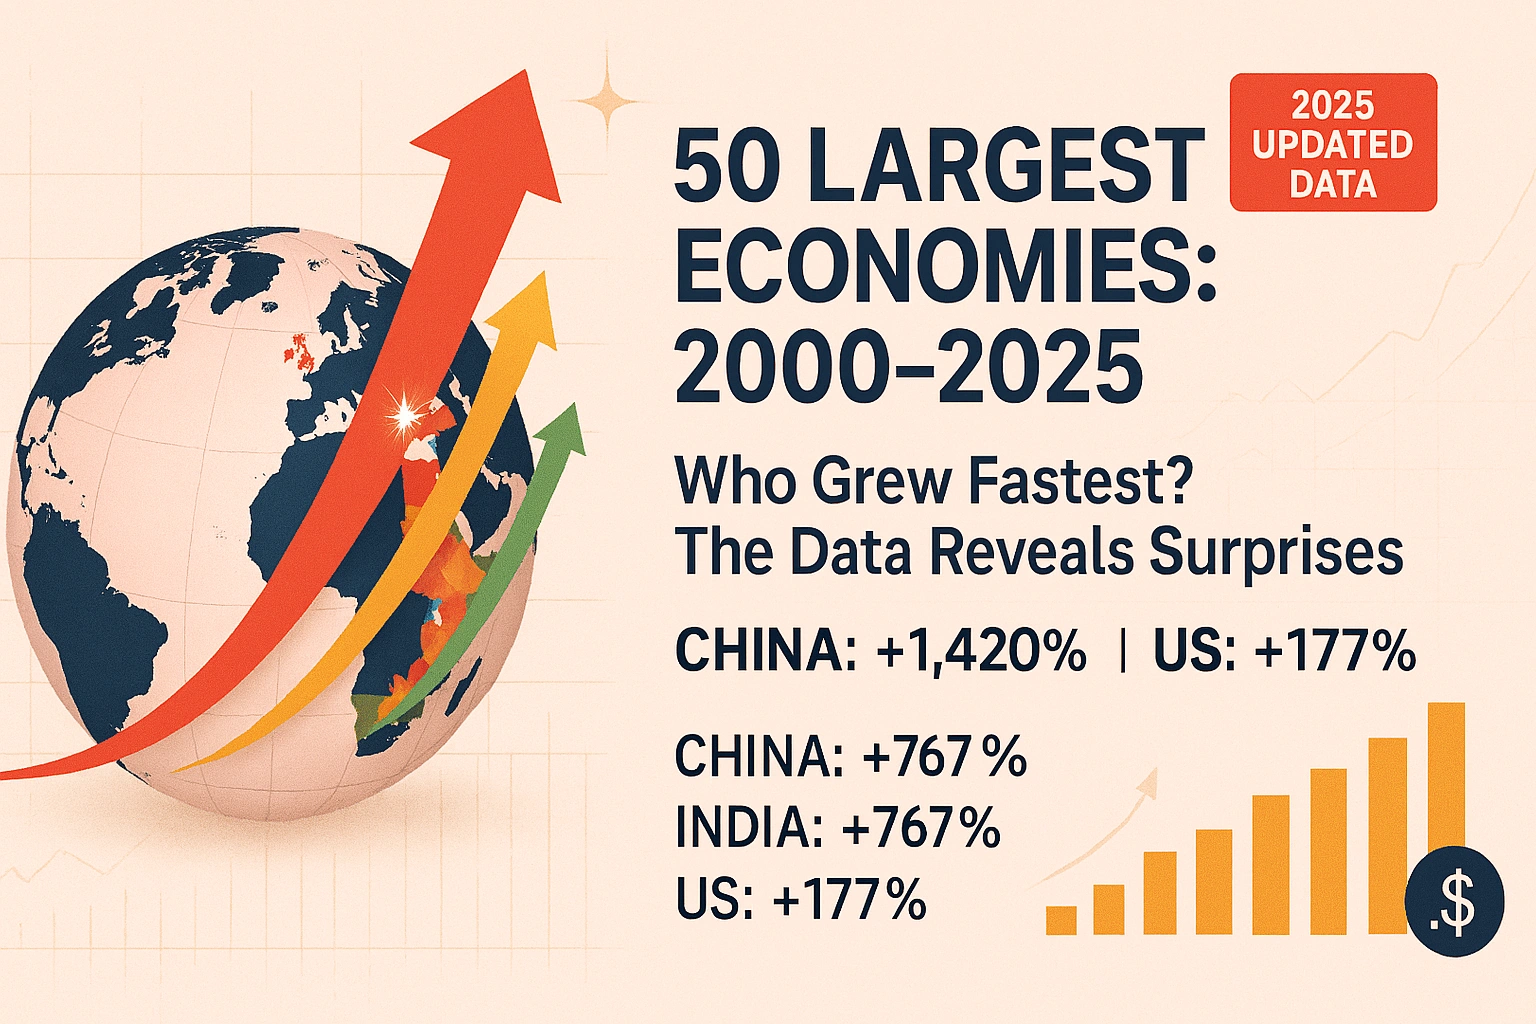
The World’s 50 Largest Economies: A 25-Year Growth Trajectory Analysis (2000-2025)

Resource Wealth and Geopolitical Vulnerability: Understanding Recent US Foreign Policy Toward Venezuela, Greenland, and Iran
-
Markets & Finance8 months ago
Top 15 Stocks for Investment in 2026 in PSX: Your Complete Guide to Pakistan’s Best Investment Opportunities
-
Analysis7 months ago
Debunking IMF Program Myths: Reconfiguring Engagement for True National Ownership in a Volatile World
-
Investment8 months ago
Top 10 Mutual Fund Managers in Pakistan for Investment in 2026: A Comprehensive Guide for Optimal Returns
-
Global Economy9 months ago
What the U.S. Attack on Venezuela Could Mean for Oil and Canadian Crude Exports: The Economic Impact
-
Asia9 months ago
China’s 50% Domestic Equipment Rule: The Semiconductor Mandate Reshaping Global Tech
-
AI9 months ago
15 Most Lucrative Sectors for Investment in Pakistan: A 2025 Data-Driven Analysis
-
Exports9 months ago
Pakistan’s Export Goldmine: 10 Game-Changing Markets Where Pakistani Businesses Are Winning Big in 2025
-
Global Economy9 months ago
Pakistan’s Stock Market Renaissance: How 2025’s Hottest Investment Opportunity Is Democratizing Wealth—A Complete Beginner’s Guide