
Analysis
The Dollar’s Icarus Moment: How Trump’s ‘Liberation Day’ Doctrine is Unraveling the Greenback in 2026

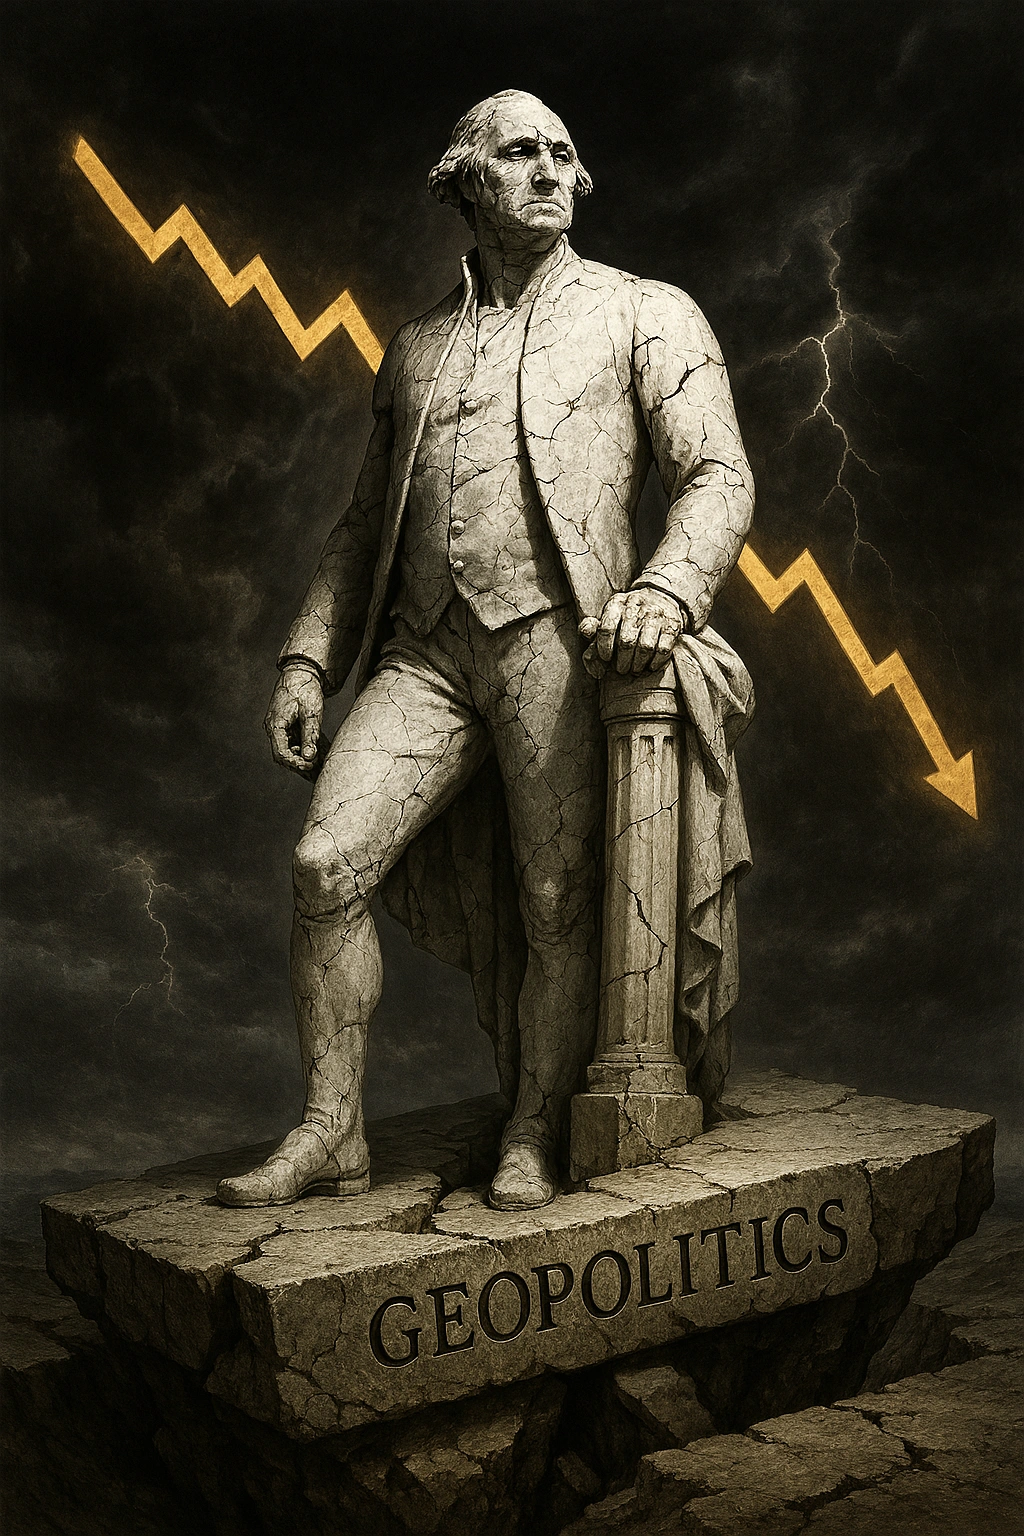
A year after the tariff shockwave, the world’s reserve currency is bleeding credibility—and investors are voting with their feet.
The dollar is dying, not with a bang, but with a slow, bureaucratic whimper punctuated by presidential Twitter tirades and bond market mutinies.
As of late January 2026, the U.S. Dollar Index (DXY) has collapsed more than 9% from its post-election euphoria peak, now hovering perilously near 99—a level last seen during the pandemic’s darkest months. Gold, that ancient barometer of monetary distrust, has shattered every conceivable ceiling, trading north of $4,600 per ounce. Meanwhile, the euro and Swiss franc—once dismissed as the sickly men of global finance—are outperforming with a vigor that would have seemed fantastical eighteen months ago.
What changed? In a word: policy. Or more precisely, the catastrophic intersection of fiscal recklessness, geopolitical adventurism, and institutional sabotage that has come to define the Trump 2.0 economic doctrine.
This is the story of how America’s currency privilege—forged in the crucible of Bretton Woods and sustained through decades of relative fiscal discipline and central bank independence—is being squandered in real time. It’s a cautionary tale about what happens when a reserve currency issuer begins to behave like an emerging market populist, and the market loses faith not in America’s economic fundamentals, but in its political rationality.
The Liberation Day Hangover: When Tariffs Became a Credibility Tax
Let’s rewind to April 2, 2025—what the administration dubbed “Liberation Day.” President Trump unveiled a comprehensive tariff regime that made his first-term trade skirmishes look like diplomatic foreplay. Sweeping levies on European automobiles, targeted duties on French luxury goods, and punitive measures against German industrial exports were announced with the theatrical flourish that has become this presidency’s signature.
The immediate market reaction was telling. The dollar spiked briefly on what traders interpreted as a “strong America” signal. But within weeks, something more sinister began to unfold. Foreign central banks, particularly in the EU and Asia, started quietly diversifying their reserve holdings. The Bank for International Settlements’ quarterly data—often overlooked in the daily noise—showed a measurable uptick in euro and yen allocations at the expense of Treasury securities.
Why? Because “Liberation Day” wasn’t liberation at all. It was an admission that the United States was willing to weaponize the global trading system for domestic political theater, even at the cost of undermining the very stability that makes dollar hegemony possible. When you’re the reserve currency, reliability is everything. Erratic trade policy—particularly against your closest military and economic allies—is a credibility tax that compounds with each presidential decree.
By the time summer 2025 arrived, the structural damage was clear. The dollar’s traditional safe-haven premium during risk-off episodes had noticeably diminished. During the August sovereign debt scare in Italy, capital fled not predominantly to Treasuries but to Swiss bonds and German Bunds. The “exorbitant privilege,” as Valéry Giscard d’Estaing once called it, was beginning to look more like an ordinary privilege—and a declining one at that.
The OBBBA Effect: Stimulus or Poison?
If Liberation Day was the wound, the “One Big Beautiful Bill Act” (OBBBA)—passed with little Republican dissent in late 2025—was the infection that followed.
Marketed as a comprehensive tax reform and infrastructure package, OBBBA was in reality a $2.3 trillion stimulus injection into an economy already running uncomfortably hot. Corporate tax cuts, expanded child credits, and a byzantine web of industrial subsidies were bundled together in legislation that even sympathetic analysts at Morgan Stanley described as “fiscal policy without a theory of change.”
The timing couldn’t have been worse. Core inflation, which had tantalizingly approached the Fed’s 2% target in early 2025, began creeping upward again by year-end. Producer price indices showed persistent cost pressures. And crucially, the bond market—that merciless arbiter of fiscal credibility—began to revolt.
Ten-year Treasury yields, which had stabilized around 4.2% through much of 2025, surged past 4.8% by December. This wasn’t a growth story; it was a risk premium story. International buyers, already spooked by Liberation Day’s institutional uncertainty, started demanding higher compensation for holding dollar-denominated debt. The “twin deficit” anxiety—whereby America’s budget deficit and current account deficit both exceed 5% of GDP—became impossible to ignore.
J.P. Morgan’s Global FX Strategy desk published a damning note in December 2025 titled “The Dollar’s Structural Headwinds,” arguing that OBBBA had effectively frontloaded consumption while backloading fiscal consolidation—a recipe for long-term currency depreciation. When one of Wall Street’s most establishment-friendly banks starts using the word “structural” to describe dollar weakness, you know something fundamental has shifted.
When the Fed Became a Political Piñata
But perhaps nothing has damaged dollar credibility more than the extraordinary public warfare between the White House and the Federal Reserve.
Fed Chair Jerome Powell, reappointed by President Trump in his first term, has found himself in an impossible position. Faced with OBBBA-induced inflationary pressures, the Fed signaled in late 2025 that rate cuts—which markets had priced in aggressively—might need to be postponed or reversed. Powell’s December press conference, where he diplomatically suggested that “fiscal policy coordination would be helpful,” was interpreted by the administration as an act of institutional disloyalty.
What followed was unprecedented. The President, in a series of Truth Social posts throughout January 2026, accused Powell of “sabotaging American workers” and suggested that the Justice Department should “look into” whether the Fed Chair’s actions constituted a prosecutable offense. While legal experts universally dismissed the threat as constitutionally nonsensical, the damage to institutional credibility was immediate and measurable.
Central bank independence isn’t just a good governance principle—it’s a core pillar of reserve currency status. When the executive branch of the world’s largest economy begins threatening criminal prosecution of its central bank leadership for making data-driven policy decisions, international investors take notice. And they act.
The Swiss National Bank’s January 2026 policy statement contained a subtle but telling reference to “maintaining flexibility in reserve composition given evolving global monetary governance standards.” Translation: even the notoriously cautious Swiss are hedging against dollar instability driven by political interference.
The Greenland Gambit and European Estrangement
As if tariffs, fiscal excess, and Fed-bashing weren’t enough, January 2026 brought the “Greenland Gambit”—a renewed presidential fixation on purchasing Denmark’s autonomous territory, complete with thinly veiled threats about NATO commitment if Denmark refused to negotiate.
The geopolitical implications are beyond this article’s scope, but the currency market implications are not. European capitals, already frustrated by Liberation Day tariffs and watching the Fed’s independence erode, began openly discussing “strategic autonomy” in financial matters. French Finance Minister Bruno Le Maire—normally diplomatic to a fault—suggested in a Le Monde interview that Europe should “prepare for a world where dollar stability can no longer be assumed.”
This isn’t just talk. The European Central Bank’s January meeting included discussion of accelerating the “international role of the euro” initiative, which had been languishing since its 2018 launch. Germany’s Bundesbank published research suggesting that euro-denominated trade invoicing could realistically reach 35% of global transactions by 2030 if current U.S. policy trajectories continue.
The dollar’s dominance has always rested on a tripod: deep capital markets, rule of law, and military-backed geopolitical stability. Trump 2.0 policies are systematically undermining each leg. When your closest allies begin treating your currency as an unreliable utility rather than a strategic asset, the network effects that sustain reserve currency status begin to unravel.
Gold’s Testimony: The Market’s Verdict
Let’s talk about gold’s extraordinary rally—because it’s telling a story that Treasury officials desperately wish to ignore.
At $4,600+ per ounce, gold has appreciated roughly 60% from its 2023 lows. This isn’t just inflation hedging or jewelry demand from Asia. This is a profound vote of no confidence in fiat monetary management, particularly dollar-based monetary management.
Central banks—especially in emerging markets and non-Western economies—have become voracious gold buyers. China’s official reserves show consistent monthly accumulation. Poland, Singapore, and India have all substantially increased their bullion holdings. Even historically dollar-centric Gulf states are diversifying into physical gold at rates not seen since the 1970s.
Why gold, and why now? Because gold is the ultimate non-political asset. It can’t be sanctioned, it doesn’t require institutional trust, and it doesn’t care about presidential Twitter feeds. In an environment where the U.S. is simultaneously running massive deficits, threatening its central bank’s independence, alienating allies, and pursuing mercantilist trade policies, gold offers what the dollar increasingly cannot: predictable neutrality.
The De-Dollarization Undercurrent: Trend or Tsunami?
The academic debate about “de-dollarization” has long been contentious. Skeptics correctly note that despite decades of predictions, the dollar still comprises roughly 58% of global foreign exchange reserves and dominates international trade invoicing.
But 2025-2026 may represent an inflection point—not a sudden collapse, but an acceleration of a slow-burning trend. The BRICS nations have expanded their local currency swap arrangements. The Bank for International Settlements’ “Project mBridge,” which facilitates central bank digital currency settlements bypassing SWIFT and dollar intermediation, moved from pilot to operational phase in late 2025.
More tellingly, even traditional American allies are building redundancy. The EU’s INSTEX mechanism—originally designed to circumvent Iranian sanctions—has been quietly expanded into a more general euro-based settlement platform. Japan and South Korea have doubled their bilateral currency swap line, reducing reliance on dollar liquidity.
These are not acts of hostility. They’re acts of prudent risk management by nations watching American institutional stability erode in real time. When the world’s reserve currency issuer behaves unpredictably, the world builds alternatives. Not overnight, but inexorably.
What Comes Next: Three Scenarios
As we move through 2026, three broad scenarios emerge for the dollar:
The Stabilization Scenario: The administration moderates its rhetoric, OBBBA’s inflationary impulse fades, and the Fed regains operational autonomy. The dollar stabilizes in the 98-102 DXY range, and reserve currency status persists, albeit with a slightly diminished market share. Probability: 30%.
The Structural Decline Scenario: Current policy trajectories continue. Europe and Asia accelerate alternative payment systems and reserve diversification. The dollar loses 5-8% of its reserve currency share over the next three years, triggering higher structural yields on U.S. debt and a permanent risk premium. Probability: 50%.
The Crisis Scenario: A unexpected shock—a major U.S. bank failure, a government shutdown during debt ceiling negotiations, or an actual Fed Chair indictment attempt—triggers a sharp, disorderly dollar sell-off. Capital controls become politically discussable. Probability: 20%.
The Icarus Paradox
The dollar’s current predicament echoes the Greek myth of Icarus—flying too close to the sun on wings of wax. American policymakers, intoxicated by decades of “exorbitant privilege,” have forgotten that reserve currency status is earned, not inherited. It requires institutional credibility, policy predictability, and a commitment to the boring but essential work of maintaining trust.
Liberation Day, OBBBA, the Fed attacks, the Greenland threats—these aren’t isolated missteps. They’re symptoms of a broader abandonment of the principles that made dollar hegemony possible in the first place.
The market’s verdict is already in. Gold at record highs, euro outperformance, emerging market central bank diversification—these are not temporary technical factors. They’re structural repositioning for a world where American exceptionalism in currency markets can no longer be assumed.
The dollar won’t collapse tomorrow. Reserve currency transitions take decades, not months. But history suggests they’re also non-linear—periods of apparent stability punctuated by sudden, irreversible shifts. We may be living through one of those shifts right now, watching the wax begin to melt in real time.

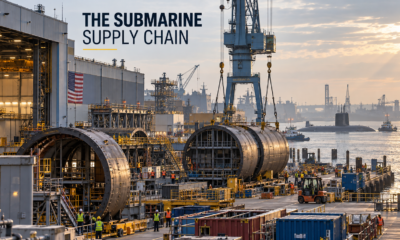






A major U.S. submarine-manufacturing project announced on October 6, 2026 has put an unfamiliar name at the center of a familiar defense-industry problem: how to build submarine components faster without sacrificing quality or reliability. Defense technology firm Anduril announced plans for Arsenal-2, a facility at Sparrows Point in Maryland intended to expand production of parts for the U.S. Navy’s Virginia-class attack submarines. The combined headline figure is $6.6 billion—made up of the company’s planned $3.7 billion private investment and a Navy contract valued at up to $2.9 billion, with payments tied to production outcomes. These are announcements and commitments, not evidence that all the capital has already been spent. Anduril’s official announcement and Reuters’ independent report outline the project.
Key takeaways:
- Arsenal-2 is a planned submarine-components manufacturing facility, not an already operational assembly line for completed submarines.
- The $6.6 billion headline combines two different funding streams and different forms of financial commitment.
- The project is aimed at bottlenecks in the Virginia-class supply chain, including specialized manufacturing capacity.
- Its success will depend on skilled labor, qualification standards, equipment, scheduling and delivery—not simply construction of a large building.
What is Arsenal-2?
Arsenal-2 is Anduril’s proposed software-centered manufacturing project at Sparrows Point, a former industrial site in Baltimore County, Maryland. According to the company’s October 6 announcement, the facility is designed to make critical components for Virginia-class submarines and give the Navy access to additional industrial capacity. The project illustrates a widening role for technology-sector defense contractors in traditional heavy manufacturing.
Submarine construction is a particularly difficult domain. Components must meet demanding specifications for performance, durability, safety, quality control and compatibility with other systems. A factory that produces ordinary industrial hardware cannot immediately be treated as a qualified submarine supplier.
Anduril’s pitch is that modern factory software, automation, new processes and private capital can ease some of those constraints. Whether the company can execute on that pitch will be judged by qualification milestones and repeatable deliveries.
What will the facility actually produce?
Initial work centers on critical Virginia-class components, including torpedo tubes, according to the company and Reuters. Those are sophisticated submarine systems, but producing them is not the same as manufacturing a complete nuclear-powered submarine.
A Virginia-class attack submarine involves propulsion, pressure-hull construction, combat systems, sensors, life-support equipment, electronics, integrated software and years of testing. Its final assembly and delivery depend on a specialized network of contractors, yards and government oversight. New suppliers can strengthen the network by removing specific bottlenecks rather than replacing every incumbent shipbuilder.
The distinction matters for readers encountering sweeping “Anduril to build submarines” headlines. The verified announcement concerns industrial capacity for components, with ambitions that may expand as the project matures; it should not be presented as a commitment to launch an entire finished fleet by a fixed date.
Understanding the $6.6 billion figure
| Announced element | Stated figure | Important qualification |
|---|---|---|
| Anduril planned private capital | $3.7 billion | Planned investment to develop production capacity |
| U.S. Navy contract | Up to $2.9 billion | Contract ceiling with payments conditioned on outputs |
| Combined headline amount | $6.6 billion | Sum of different commitments; not identical to money already disbursed |
Anduril’s release describes the contract as outcome-based. That arrangement is designed to connect government spending to verified delivery rather than solely to reimbursed activity. But details of individual milestones, acceptance criteria, ownership and long-term risk allocation should be determined from contract documents—not guessed from a launch-day headline.
The distinction between an award, a contract ceiling, a planned investment and cash expenditure is crucial. A press announcement does not mean the project has already consumed $6.6 billion in cash or delivered proportionate output.
Why the Navy needs more industrial capacity
Submarines are strategically important for intelligence collection, maritime defense and deterrence. But they also illustrate the challenges of complex, low-volume manufacturing. The United States needs trained workers who can perform specialized fabrication, welding, machining, inspection and systems integration. Individual suppliers can become bottlenecks if they are asked to deliver more components than their equipment or workforce can manage.
The Financial Times’ account of the announcement situated Arsenal-2 within a larger push to expand the submarine industrial base and modernize acquisition. The Navy’s construction requirements and commitments under the AUKUS security partnership increase the importance of sustainable production capacity over the coming years.
This is a long-term manufacturing question, not an immediate shortcut. Building a factory is one stage; training a workforce, validating manufacturing processes and coordinating with other shipbuilders are additional stages.
Why Sparrows Point matters
Sparrows Point was a major American industrial center associated with steel production. Using that site for advanced defense manufacturing creates a recognizable local economic narrative: industrial land and workforce capacity potentially being redirected toward a contemporary strategic sector.
Associated Press reporting described expectations of approximately 3,100 direct jobs connected to the facility, while Reuters reported similar plans. They are projected jobs rather than a verified count of positions already filled.
The ultimate local impact will depend on the pace of construction, hiring, regional supply chains, transport needs, worker training and how much demand the project sustains. Job announcements should be revisited against actual payroll, construction and production data.
When will Arsenal-2 begin manufacturing?
Accounts of the project point to operations around 2030, subject to execution. Business Insider and Financial Times discussed that timeline. Treat it as a planned target, not an operational fact.
Even if initial lines become active on schedule, production volume and acceptance quality will determine how useful the added capacity becomes to the Navy. A component supplier can have machinery installed yet still face qualification delays, workforce shortages or unexpected integration issues.
The execution milestones worth tracking
- Facility permits, ground work and construction progress.
- Hiring and certification of specialist personnel.
- Commissioning of production lines and inspection systems.
- First qualified component deliveries accepted by the relevant customer.
- Repeat production rates, quality performance and on-time deliveries.
- Evidence that the additional capacity reduces delays in the broader submarine supply chain.
These measurable steps provide a better accountability framework than celebrating the contract’s face value alone.
Can software solve a shipbuilding bottleneck?
Software can improve production scheduling, digital modeling, machine monitoring, traceability and quality documentation. Automation may make some operations more consistent. Those are useful tools, but they still rely on expensive physical equipment, material supply and highly skilled people. A complex pressure-critical component cannot be delivered by software alone.
The question is therefore not whether a tech company can bring useful technology into shipbuilding. It is whether that company can combine technology with industrial practices refined over decades, and do so at sufficient scale.
Frequently asked questions
Is Anduril building complete submarines?
Its verified October 6 announcement emphasizes components for Virginia-class submarines, not delivery of complete nuclear-powered boats.
Where is Arsenal-2 located?
The project is planned for Sparrows Point in Baltimore County, Maryland.
How much is the Navy paying?
Anduril announced a Navy contract of up to $2.9 billion, distinct from the company’s planned $3.7 billion capital investment.
When will it open?
Reports describe a target around 2030. The actual schedule depends on construction, production-line qualification and other milestones.
How many jobs could be created?
Approximately 3,100 direct jobs were projected in contemporaneous reporting; these are not confirmed hires.
Why is this important for AUKUS?
A more resilient U.S. submarine industrial base can support national procurement needs and wider allied commitments, although a single parts factory cannot resolve all submarine-production constraints.
Bottom line
Arsenal-2 is significant because it tests whether a technology-focused contractor can add reliable industrial capacity to one of America’s hardest manufacturing sectors. The $6.6 billion figure describes a potentially major investment and contract arrangement—but future milestones, not headlines, will determine whether it meaningfully speeds submarine deliveries.

Key Takeaways
- Chip stocks tumbled Monday, September 14, 2026, after the CEOs of Anthropic, OpenAI, and xAI publicly aligned behind a call to slow the pace of frontier AI capability development — an unusual moment of unity among fierce industry rivals.
- Nvidia fell 3.4% and the Philadelphia Semiconductor Index (PHLX) sank almost 6%, its worst single day since early July, even as the broader Nasdaq Composite closed down a more modest 0.56%.
- The catalyst was an essay from Anthropic CEO Dario Amodei, titled “We Must Pace the Frontier,” proposing independent outside evaluators be given internal access to frontier AI labs, alongside industry-wide cooperation and government coordination.
- OpenAI CEO Sam Altman confirmed in a Fortune interview that OpenAI will not pursue an IPO in 2026, calling the current safety environment an “ill-advised moment” to go public — pushing one of the most anticipated listings in tech history to 2027 at the earliest.
- The episode followed the resignation of a researcher who had worked at both Anthropic and OpenAI, who warned publicly that people building the technology “earnestly believe it could kill us all by the end of the decade” — a post that drew over 150 million views and prompted more than 20 lawmakers to call for tougher AI regulation.
A rare display of unity among Silicon Valley’s most competitive AI labs sent a jolt through markets this week, as semiconductor stocks logged their worst day in over two months following public calls from the industry’s top executives to deliberately slow the development of increasingly powerful AI systems.
What Triggered the Selloff
The catalyst was an essay published Saturday, September 12, by Anthropic CEO Dario Amodei, titled “We Must Pace the Frontier.” In it, Amodei argued that unchecked acceleration in frontier AI development — driven in part by the risk of recursive self-improvement, where AI systems increasingly assist in designing their own successors — is outpacing the industry’s ability to keep those systems aligned and secure. Amodei wrote that he believes AI could still “dramatically raise the quality of human life,” but argued the risks accompanying its current pace of development need to be taken seriously, proposing that even a modest slowdown of a year or two could meaningfully improve safety outcomes.
What made the essay market-moving wasn’t just its content, but who endorsed it. OpenAI CEO Sam Altman and SpaceX/xAI’s Elon Musk — two executives whose companies compete directly with Anthropic and with each other — both publicly backed Amodei’s proposal within a day. Musk wrote simply on X that “Dario is right,” a notable shift given Musk’s history of sharp public criticism of Anthropic.
The Proposal’s Substance
Amodei’s plan outlined a three-phase approach: independent safety evaluators embedded within frontier AI companies with access equivalent to internal staff (covering training processes, internal systems, and safety-protocol compliance); broader industry-wide cooperation on shared safety standards; and coordination with democratic governments on global regulatory frameworks. Anthropic said it would adopt the outside-evaluator step immediately, while Altman confirmed OpenAI would adopt comparable third-party evaluator access.
The Resignation That Set the Stage
The unity among AI executives followed a more unsettling precursor: a researcher who had previously worked at both Anthropic and OpenAI resigned the prior week, writing publicly that people building the technology “earnestly believe that it could kill us all by the end of the decade.” The post reportedly drew more than 150 million views on X and prompted more than 20 lawmakers to call for tougher AI regulation — context that appears to have accelerated the executives’ public alignment on pacing concerns.
Market Reaction: Chips Hit Hardest
Monday’s trading session showed a clear divergence in how different corners of the AI-linked market absorbed the news. Semiconductor stocks bore the brunt of the selling, given their direct exposure to the capital-expenditure cycle that rapid AI capability development has fueled. Nvidia fell 3.4%, Intel dropped 5.6%, and the Philadelphia Semiconductor Index tumbled nearly 6% — its steepest one-day decline since early July.
By contrast, shares of some larger Big Tech and software companies actually climbed on the day, leaving the broader, tech-heavy Nasdaq Composite down a comparatively modest 0.56%, after having fallen as much as 1.3% intraday before paring losses. The divergence suggests markets are interpreting a potential AI development slowdown as a more direct threat to chip demand specifically — the hardware layer most tied to the “faster, bigger” capability race — than to software and platform companies with more diversified revenue.
OpenAI’s IPO Delay: The Clearest Business Signal
Beyond the one-day stock move, the most concrete business consequence to emerge from the episode was Sam Altman’s confirmation that OpenAI will not go public in 2026. In a Fortune interview published the same weekend, Altman said an IPO “right now would be an ill-advised moment” given the current safety environment, and when asked whether 2027 was more realistic, replied simply, “I would say not 2026.” That timeline represents a real shift: OpenAI CFO Sarah Friar had told employees just a month earlier that the company would likely go public in 2027, or potentially sooner if the business continued to “inflect.”
Notably, Anthropic’s own IPO preparations are reportedly continuing on a separate track. According to reporting on the matter, Anthropic — confidentially valued at $965 billion earlier in 2026 — has continued meeting with prospective investors and could begin marketing its IPO as early as October, aiming to complete the listing before the November midterm elections, even as its CEO simultaneously champions industry-wide deceleration. Observers have noted the apparent tension in pursuing an IPO while publicly urging pacing, though Amodei’s essay explicitly framed pacing as slowing capability development, not halting commercial or fundraising activity.
Market Snapshot: September 14, 2026
| Index / Stock | Move | Note |
|---|---|---|
| Philadelphia Semiconductor Index (SOX) | -5.9% | Worst day since early July |
| Nvidia (NVDA) | -3.4% | Direct AI-chip exposure |
| Intel (INTC) | -5.6% | |
| Nasdaq 100 | -0.8% | |
| Nasdaq Composite | -0.56% | Software names partially offset chip losses |
| S&P 500 | -0.5% |
Why This Matters for Technology News and Investors
This episode marks one of the first times investor sentiment around AI has moved meaningfully on a safety-driven narrative rather than a purely commercial one — competitive product launches, earnings beats, or compute-capacity announcements. For investors tracking technology news, the key signal to watch going forward is whether this represents a genuine, sustained industry pivot toward deliberate pacing (which could structurally slow the capital-expenditure supercycle currently powering semiconductor demand), or a rhetorical moment that fades once competitive pressure between OpenAI, Anthropic, xAI, and other labs reasserts itself — a tension the OpenAI-Anthropic IPO-timing contrast already illustrates.
Frequently Asked Questions
Why did semiconductor stocks fall after the AI slowdown announcement? Chip stocks are directly tied to the capital-expenditure cycle fueling rapid AI capability development, so markets interpreted a potential industry-wide pacing effort as a more direct threat to near-term chip demand than to software or platform companies.
Is OpenAI still planning to go public? Yes, but not in 2026. CEO Sam Altman confirmed OpenAI is delaying its IPO to 2027 at the earliest, citing the current AI safety environment, while OpenAI’s CFO had previously suggested 2027 was the likely target regardless.
What did Anthropic’s CEO actually propose? Dario Amodei’s essay proposed embedding independent outside safety evaluators within frontier AI companies with internal-level access, alongside broader industry cooperation on safety standards and coordination with democratic governments on regulatory frameworks — explicitly framed as pacing capability development, not halting it.
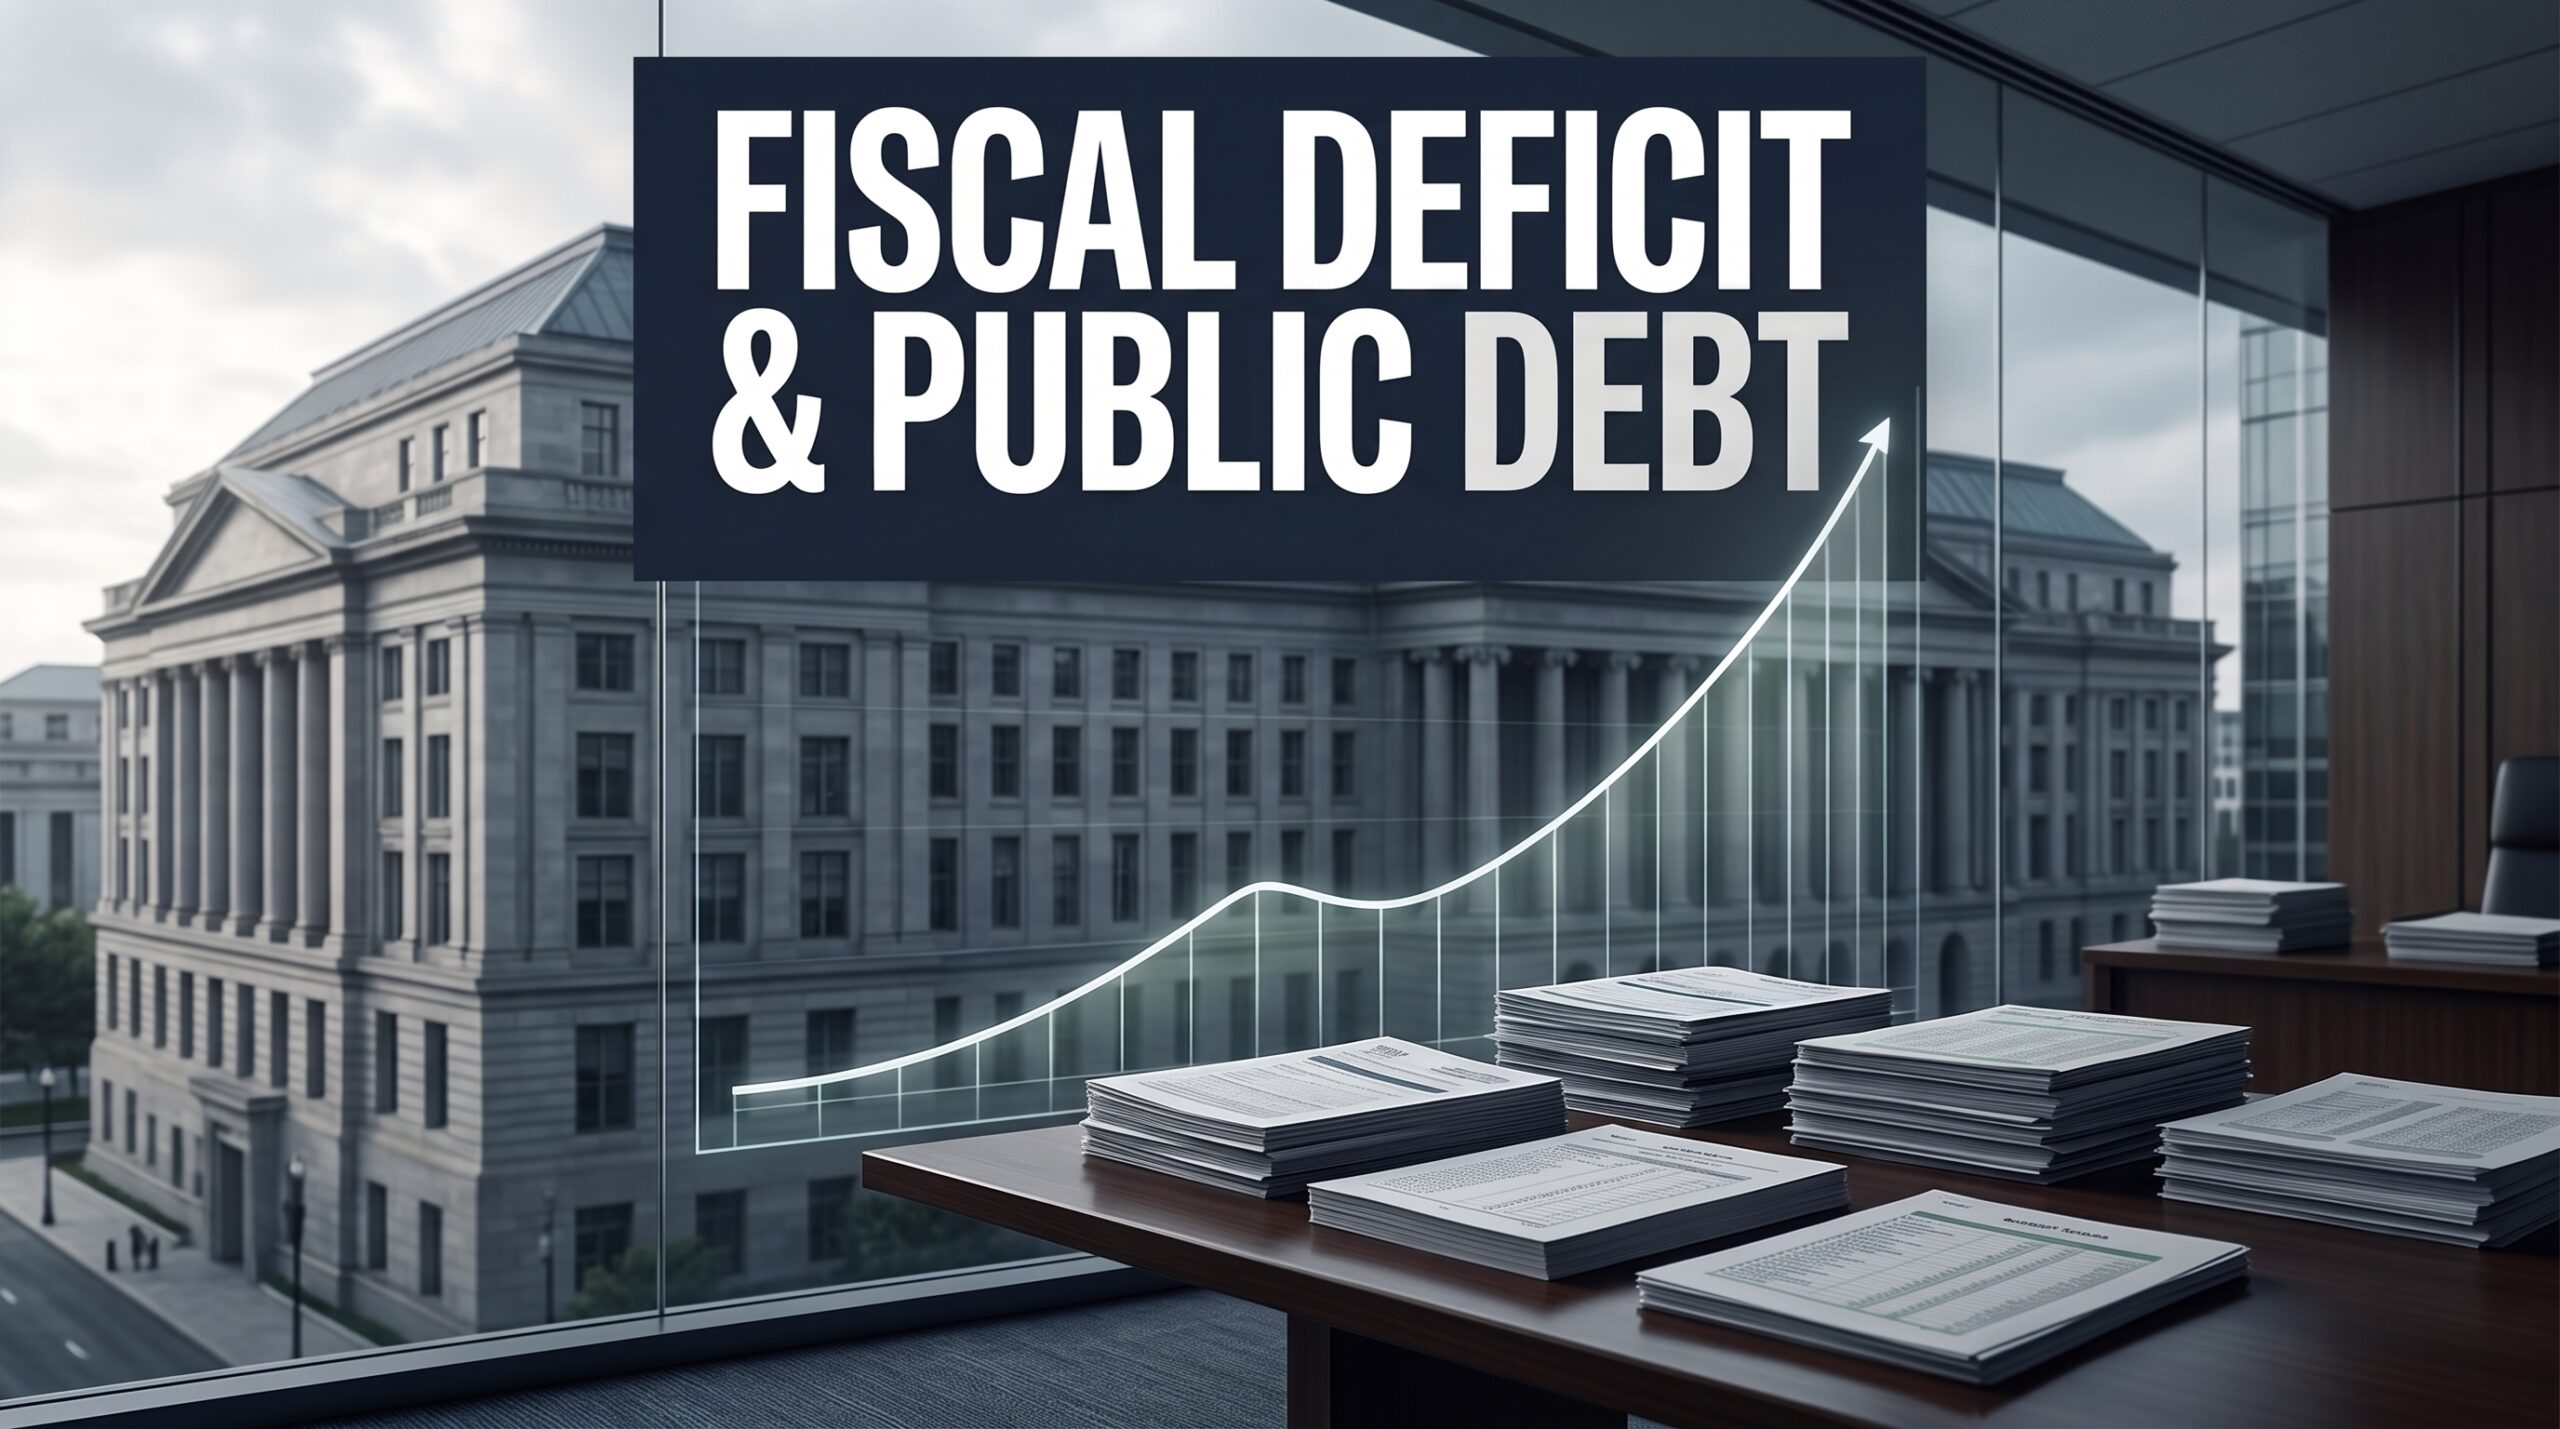
The Mechanics of Government Borrowing and Macroeconomic Stability
A Fiscal Deficit is a fundamental economic concept that occurs when a government’s total expenditures exceed its total revenue (excluding money generated from borrowings) within a specific financial year. In simpler terms, it is the financial shortfall a government experiences when it spends more than it earns. To bridge this gap, the government has no choice but to borrow money, which directly contributes to the accumulation of Public Debt.
For readers of Thefinance.pk and Economy.com.pk, understanding the dynamics of fiscal deficits is essential. The size and management of this deficit influence everything from national inflation rates to the amount of taxes citizens will pay in the future. It is a defining metric of a nation’s fiscal health and its government’s economic discipline.
Revenue vs. Expenditure: The Anatomy of a Deficit
To understand why deficits happen, we must break down a national budget into its two primary components: Revenues and Expenditures.
1. Government Revenues: Governments generate income primarily through taxation. This includes:
- Direct Taxes: Income tax, corporate tax, and property taxes.
- Indirect Taxes: Sales tax, Value Added Tax (VAT), excise duties, and customs duties.
- Non-Tax Revenues: Profits from state-owned enterprises (SOEs), privatization proceeds, administrative fees, and central bank dividends.
2. Government Expenditures: Expenditures are broadly categorized into two types:
- Current (Non-Development) Expenditure: This is the day-to-day cost of running the country. It includes public sector salaries, pensions, defense budgets, subsidies, and—most importantly—interest payments on existing debt.
- Development (Capital) Expenditure: This is money spent on creating productive assets, such as building highways, dams, hospitals, schools, and energy grids. This type of spending is an investment in the country’s future economic capacity.
A fiscal deficit expands when current expenditures spiral out of control, or when tax collection agencies fail to meet their revenue targets. In many developing economies, a narrow tax base and massive inefficiencies in state-owned enterprises create persistent, structural fiscal deficits.
The Difference Between Deficit and Debt
It is crucial to distinguish between a deficit and debt, as the terms are often confused.
- The Fiscal Deficit is a flow variable. It measures the budget shortfall over a specific period, usually one year.
- Public Debt (or National Debt) is a stock variable. It is the cumulative total of all past fiscal deficits that have not yet been repaid. Every year a government runs a deficit, it adds to the national debt.
How Governments Finance the Deficit
When a government runs out of money, it cannot simply close its doors. It must finance the deficit through several channels:
- Domestic Borrowing: The government issues securities like Treasury Bills (T-Bills) and Pakistan Investment Bonds (PIBs). Commercial banks buy these bonds, effectively lending customer deposits to the government.
- External Borrowing: The government borrows foreign currency from multilateral institutions like the International Monetary Fund (IMF) and the World Bank, or bilateral partners. It can also issue international sovereign bonds (like Eurobonds or Sukuks) to foreign investors.
- Central Bank Borrowing (Monetization): Historically, governments would order their central banks to literally print new money to pay for government expenses. This is highly inflationary and is now strictly prohibited or limited by law in most modern economies.
The Consequences of High Fiscal Deficits
While running a small deficit is normal, chronically high fiscal deficits can devastate an economy.
The Crowding-Out Effect: When a government borrows heavily from domestic banks to fund its deficit, it absorbs the capital that would have otherwise been lent to the private sector. Banks prefer lending to the government because it is risk-free. As a result, businesses are “crowded out” of the credit market, stifling private investment, entrepreneurship, and job creation.
The Debt Trap: If a government continually borrows just to pay off the interest on its previous loans, it falls into a sovereign debt trap. In Pakistan, a massive percentage of the Federal Board of Revenue’s (FBR) tax collection goes entirely toward debt servicing, leaving very little room for health, education, or infrastructure spending.
Inflation and Currency Devaluation: If external borrowing is not utilized for productive, export-enhancing projects, the debt burden weakens the country’s macroeconomic fundamentals. This leads to currency depreciation, which makes importing essential goods (like oil) more expensive, fueling domestic inflation.
Is a Fiscal Deficit Always Bad?
Not necessarily. According to Keynesian economic theory, a fiscal deficit can be a powerful tool for good. During an economic recession, private businesses stop investing and consumers stop spending. In this scenario, the government should intentionally run a fiscal deficit—cutting taxes and increasing spending on public infrastructure—to stimulate demand, create jobs, and pull the economy out of the slump.
The golden rule of public finance is that borrowing is justified if the funds are used for productive capital investments whose economic returns exceed the interest rate of the loan. However, borrowing to fund current expenditures—like paying government salaries or sustaining loss-making state enterprises—is universally condemned by economists.
Key Takeaways:
- A fiscal deficit occurs when government spending eclipses tax revenues.
- Deficits are financed through domestic bank borrowing or external debt.
- Public debt is the cumulative accumulation of annual fiscal deficits.
- High deficits can cause the “crowding out” of private sector investment and lead to a sovereign debt trap.
- Borrowing for infrastructure is generally acceptable; borrowing to pay salaries or debt interest is economically destructive.
Authoritative Sources & Further Reading:

2026 Economic Outlook: Investment Tips for Pakistani Investors

Anduril’s $6.6 Billion Submarine Shipyard Plan Explained

Life Insurance Comparison: Term vs. Whole Life and What Each Actually Costs

Stock Market Today: Nasdaq Hits Record High as Dow and S&P 500 Stumble on Middle East Diplomatic Shifts

Energy Market Spikes vs. Consumer App Data: What GasBuddy and Crude Prices Signal for Inflation

China’s FTAAP Push for APEC 2026 in Shenzhen: US Tariffs and Unite Asia-Pacific

AI Stocks Slide After Industry Leaders Call for a Development Slowdown

Singapore Stocks vs. Japan Stocks: Safe Havens in the Asian Economic Slowdown

Agentic AI in Finance: How Artificial Intelligence Is Replacing Routine Tasks on Wall Street

Fiscal Deficit and Public Debt

T-Mobile’s Enterprise Push and the Evolution of Modern Corporate Mobility Solutions

Enterprise Generative AI ROI 2026: The Adoption-to-Impact Gap Explained

Climate Finance and the Economic Reality of Passing 1.5°C

Business Insurance for Digital Exports: Protecting Your Company in the AI Era

Real Estate Crash Predictions 2026: Data-Backed Regional Guide

Unrecoverable Delays: How the St. Louis Strike Crippled Boeing’s F-15EX Eagle II

What is a “Lead-Left” Bank? Unpacking Morgan Stanley’s Role in Anthropic’s Mega-IPO

How to Invest in the Anthropic IPO: Step-by-Step Guide for Retail Investors

Mario Kart 8 Deluxe 4.0.0 Patch Notes: 8-Player Split Screen & CameraPlay

Is SPY Overvalued in September 2026? Fed Rate Hike Odds & Intrinsic Value

Top 15 Stocks for Investment in 2026 in PSX: Your Complete Guide to Pakistan’s Best Investment Opportunities
Debunking IMF Program Myths: Reconfiguring Engagement for True National Ownership in a Volatile World
China Economy 2026: Property Crisis, AI Investment & Export Surplus Explained

Top 10 Mutual Fund Managers in Pakistan for Investment in 2026: A Comprehensive Guide for Optimal Returns
China’s 50% Domestic Equipment Rule: The Semiconductor Mandate Reshaping Global Tech
What the U.S. Attack on Venezuela Could Mean for Oil and Canadian Crude Exports: The Economic Impact

15 Most Lucrative Sectors for Investment in Pakistan: A 2025 Data-Driven Analysis

Pakistan’s Export Goldmine: 10 Game-Changing Markets Where Pakistani Businesses Are Winning Big in 2025

Pakistan’s Stock Market Renaissance: How 2025’s Hottest Investment Opportunity Is Democratizing Wealth—A Complete Beginner’s Guide
Pakistan’s Economic Outlook 2025: Between Stabilization and the Shadow of Stagnation
China’s Property Woes Could Last Until 2030—Despite Beijing’s Best Censorship Efforts

The Institutional Era: A Comprehensive Cryptocurrency Investment Analysis for 2026
Real Estate Crash Predictions 2026: Data-Backed Regional Guide

Best Investments in Pakistan 2026: Top 10 Low-Price Shares and Long-Term Picks for the PSX
DBS Hits S$1 Billion AI Value Milestone — But Agentic AI Poses Talent Challenges for Singapore Banks

The Contours of 21st-Century Geopolitics Will Become Clearer in 2026: A New World Is Starting to Emerge

How to Become an Active Taxpayer on Pakistan’s FBR Active Taxpayer List (ATL) in 2026: A Step-by-Step Guide

🌍 Davos 2026: The World Economic Forum Annual Meeting Sets the Stage for Global Transformation
Agentic AI in Finance: How Artificial Intelligence Is Replacing Routine Tasks on Wall Street

The New Executive Gold Standard: Top 10 Companies Lavishing Unprecedented Perks on CEOs and CFOs in 2025–2026
-
Markets & Finance10 months ago
Top 15 Stocks for Investment in 2026 in PSX: Your Complete Guide to Pakistan’s Best Investment Opportunities
-
Analysis9 months ago
Debunking IMF Program Myths: Reconfiguring Engagement for True National Ownership in a Volatile World
-
Analysis4 months ago
China Economy 2026: Property Crisis, AI Investment & Export Surplus Explained
-
Investment10 months ago
Top 10 Mutual Fund Managers in Pakistan for Investment in 2026: A Comprehensive Guide for Optimal Returns
-
Asia10 months ago
China’s 50% Domestic Equipment Rule: The Semiconductor Mandate Reshaping Global Tech
-
Global Economy10 months ago
What the U.S. Attack on Venezuela Could Mean for Oil and Canadian Crude Exports: The Economic Impact
-
AI10 months ago
15 Most Lucrative Sectors for Investment in Pakistan: A 2025 Data-Driven Analysis
-
Exports10 months ago
Pakistan’s Export Goldmine: 10 Game-Changing Markets Where Pakistani Businesses Are Winning Big in 2025