
Global Economy
Trump’s December Address: The Reality Behind the Rhetoric

As approval ratings crater, the president’s primetime speech reveals a White House struggling to reconcile campaign promises with economic headwinds
When President Trump declared from the Diplomatic Reception Room on Wednesday evening that he had “inherited a mess” and was now “fixing it,” he unknowingly captured the central paradox of his second term. Nearly eleven months into his presidency, Trump claims to have brought “more positive change to Washington than any administration in American history,” yet this assertion collides uncomfortably with economic data showing Americans increasingly pessimistic about their financial futures. The disconnect between the president’s triumphalist rhetoric and voters’ lived experience isn’t merely a messaging problem—it’s become a political crisis that threatens Republican control of Congress in 2026.
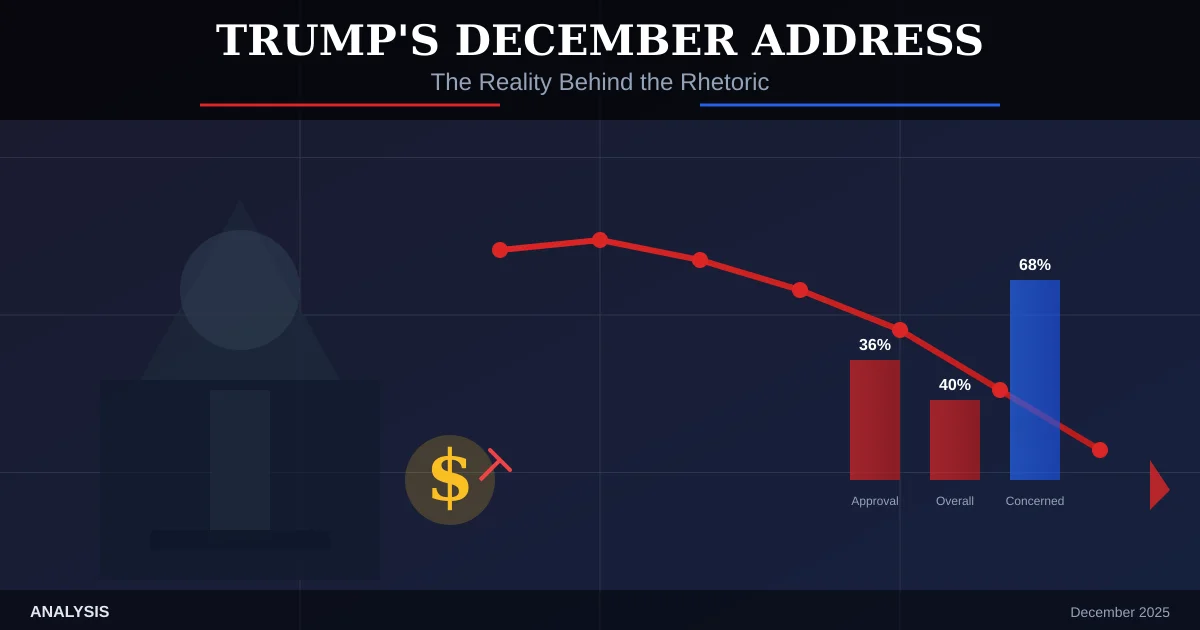
The most revealing aspect of Trump’s address wasn’t what he announced, but what he avoided. Beyond unveiling a $1,776 “warrior dividend” for military personnel—a $2.5 billion expenditure funded by tariff revenues—the twenty-minute speech broke little new policy ground. Instead, it offered a familiar litany of achievements, exaggerated statistics, and blame directed at his predecessor. What went unmentioned speaks volumes: Trump’s economic approval has plummeted to just 36% according to the latest NPR/PBS News/Marist poll, marking the lowest point of either of his presidential terms. For a politician who built his brand on economic competence, this represents a devastating reversal.
The Affordability Crisis Trump Can’t Spin Away
The numbers tell a story Trump’s rhetoric cannot obscure. Sixty-eight percent of Americans, including 44% of Republicans, now say the economy is in poor shape, according to the Associated Press-NORC survey conducted in early December. Perhaps more troubling for the White House, 45% of Americans identify prices as their top economic concern—more than double the next highest category. This isn’t abstract economic anxiety; it’s concrete kitchen-table distress.
Trump claimed gasoline now costs under $2.50 per gallon “in much of the country,” but AAA data shows the national average at $2.90—only 13 cents lower than a year ago. His assertion that egg prices have fallen 82% since March, while directionally accurate about wholesale prices, masks a more complex story about supply chain disruptions and avian flu recovery. These selective statistics reveal a White House more focused on crafting favorable narratives than addressing underlying economic pressures.
The president’s boast about solving grocery price inflation rings particularly hollow. While it’s true that some commodity prices have moderated, 70% of Americans now describe the cost of living as “not very affordable” or “not affordable at all”—the highest level since Marist began tracking this measure in 2011. Just six months earlier, only 45% expressed similar concerns. This dramatic deterioration in perceived affordability represents one of the sharpest swings in consumer sentiment in recent memory.
The Tariff Trap: When Economic Theory Meets Political Reality
Trump’s warrior dividend announcement inadvertently highlighted the administration’s central economic gamble: that tariff revenues can fund government priorities without imposing costs on American consumers and businesses. This assumption has proven spectacularly wrong.
The Tax Foundation estimates that Trump’s imposed tariffs will reduce U.S. GDP by 0.5% and amount to an average tax increase of $1,100 per household in 2025, rising to $1,400 in 2026. These aren’t abstract economic projections—they’re manifesting in real-world price increases across sectors. Research by Harvard economist Alberto Cavallo and colleagues found that the inflation rate would have been 2.2% rather than current levels had it not been for Trump’s tariffs.
The political consequences are becoming apparent. Two-thirds of Americans express concern about tariffs’ impact on their personal finances, while business uncertainty has contributed to a dramatic slowdown in hiring. November saw just 64,000 jobs added, while October recorded a loss of 105,000 positions, driven largely by federal workforce reductions but exacerbated by private sector caution. The unemployment rate climbed to 4.6%—the highest level in four years.
Small businesses bear a disproportionate burden. Unlike large retailers with sophisticated supply chains and pricing power, small importers face existential pressure. One small business owner told CNBC that complexity in her supply chain has increased tenfold, while revenue has declined year-over-year. With approximately 36 million small businesses accounting for 43% of U.S. GDP, their struggles have macroeconomic implications that extend far beyond individual balance sheets.
The Midterm Mathematics Don’t Add Up
Trump’s address comes as Republicans confront an uncomfortable political reality: the affordability message that propelled them to victory in 2024 has become a vulnerability. Recent Quinnipiac polling shows only 40% of Americans approve of Trump’s job performance, with 54% disapproving, while his economic approval sits even lower. Among critical swing constituencies, the erosion is severe—rural voters and white women without college degrees, both core Republican groups, now disapprove of his economic stewardship by significant margins.
The November off-year elections offered a preview of potential 2026 outcomes. Democrats swept gubernatorial races in Virginia and New Jersey, and captured the New York City mayoralty—all by centering campaigns on affordability and cost-of-living concerns. In an echo of the Republican playbook from 2024, progressive candidates successfully framed GOP economic policies as benefiting corporations while hurting families. The political tables have turned with stunning speed.
Historical precedent suggests danger ahead. Trump’s overall approval stands at 38% in some surveys—comparable to his April 2018 rating, which preceded Republicans losing 40 House seats in the midterm elections. The intensity of disapproval is particularly concerning; 50% of registered voters say they “strongly disapprove” of the president’s performance, a level of polarized opposition that typically drives high opposition turnout.
The Federal Reserve Dilemma
Trump’s promise to announce “someone who believes in lower interest rates by a lot” as the next Federal Reserve chairman reveals a fundamental misunderstanding—or deliberate misrepresentation—of monetary policy constraints. The Fed faces a trilemma: supporting growth, controlling inflation, and maintaining dollar stability. Trump’s tariff policies have made this balancing act significantly more difficult.
Average hourly earnings rose just 0.1% in November, suggesting wage pressures remain subdued. Yet inflation persists at around 3%—above the Fed’s 2% target and sticky enough to limit aggressive rate cuts. The November jobs report, showing unemployment at a four-year high alongside sluggish hiring, presents precisely the stagflationary scenario that gives central bankers nightmares.
Political pressure on the Fed to prioritize growth over inflation stability could undermine the institution’s credibility, risking long-term economic damage for short-term political gains. Markets appear skeptical; despite Trump’s optimistic projections, probability of a January rate cut remains low, with traders pricing in limited easing through 2026.
What Wasn’t Said Matters More Than What Was
The twenty-minute address notable omissions reveal a White House in damage-control mode. Trump made no mention of health care, despite millions of Americans facing higher premiums in 2026 due to expiring Affordable Care Act subsidies—a crisis that contributed to the recent government shutdown. He offered no concrete plan to address housing affordability, despite promising “some of the most aggressive housing reform plans in American history.” These vague future commitments suggest policy initiatives remain underdeveloped even as political pressure mounts.
Perhaps most tellingly, Trump avoided discussing the budget deficit or federal debt, despite his tariff-for-revenue strategy falling short of financing goals. The warrior dividend, while symbolically appealing, exemplifies the problem: using trade policy to fund discrete initiatives without addressing systemic fiscal challenges. It’s governance by announcement rather than comprehensive planning.
The Road Ahead: Campaign Mode Cannot Solve Governing Challenges
The address “had the feel of a Trump rally speech, without the rally,” one observer noted—an apt description of an administration struggling to transition from campaign mode to governing reality. Rally rhetoric energizes the base but doesn’t lower grocery bills or create jobs. As Democrats discovered during Biden’s tenure, economic perception often matters more than economic statistics, and perception has turned decisively negative.
Trump faces an increasingly narrow path forward. His approval among Republicans remains robust at around 84%, providing a stable floor but insufficient for broader political success. To rebuild credibility on economic management, the administration needs to deliver tangible affordability improvements before the 2026 midterm campaign begins in earnest—likely by summer 2026.
Three potential scenarios emerge. First, the administration could scale back tariffs, accepting short-term political embarrassment to ease price pressures and business uncertainty. Second, the White House might pursue aggressive fiscal stimulus, risking inflation but boosting consumer spending power. Third—and most likely—Trump continues doubling down on his current approach, gambling that economic conditions improve independently or that he can successfully blame Democrats for ongoing problems.
The December address suggests the third path. Trump spent more time deflecting blame toward Biden than outlining forward-looking solutions. This backward-looking posture may satisfy core supporters but does little to win back skeptical independents and suburban voters whose support determines congressional majorities.
The Bigger Picture: Populism Meets Economic Reality
Trump’s predicament illustrates a broader challenge facing populist economic nationalism: converting campaign slogans into sustainable policy proves considerably harder than winning elections. Tariffs were supposed to protect American workers, rebuild manufacturing, and generate government revenue—a win-win-win proposition. Instead, they’ve produced a lose-lose-lose outcome: higher consumer prices, business uncertainty dampening investment and hiring, and insufficient revenue to offset their economic drag.
The president’s address revealed an administration caught between its ideological commitments and economic realities. Unable to acknowledge that signature policies might be failing, yet unable to convince voters that those policies are succeeding, Trump has retreated into an increasingly defensive crouch. The warrior dividend—a one-time payment to a politically sympathetic constituency—exemplifies the thinking: targeted gestures to shore up support rather than comprehensive solutions to systemic problems.
As the 2026 midterms approach, Republicans face an uncomfortable question: Can Trump’s personal political skills overcome objective economic headwinds? History suggests the answer is no. Midterm elections typically serve as referendums on presidential performance, particularly economic performance. With affordability concerns at fourteen-year highs, unemployment rising, and business confidence weakening, the political environment increasingly resembles 2018’s Democratic wave election—only in reverse.
The December address offered reassurance to supporters but did little to expand the coalition Trump needs to maintain congressional majorities. Perhaps that was always its purpose: shoring up the base rather than persuading skeptics. If so, it represents a strategic retreat from the ambitious claims that opened the speech. Bringing “more positive change than any administration in American history” requires more than declaring it—it requires delivering results that voters can see and feel. On that metric, Trump’s second term remains very much a work in progress, and patience is wearing thin.


On September 2, 2026, the UN Environment Programme published a report that treated something once framed as a worst-case risk as a settled outcome: the world will pass 1.5°C of warming. “Limiting Overshoot: Navigating Exceedance of 1.5°C and Pathways Towards Return” marks a deliberate shift in framing, from preventing a threshold breach to managing one already underway — with direct, quantified consequences for climate finance, carbon-removal markets, and the economics of adaptation that businesses and investors now need to plan around.
Key Takeaways
- UNEP’s September 2, 2026 report puts best-case peak warming at 1.8°C even under the most optimistic current government pledges, with a median of around 2.6°C by 2100 (range 1.9°C–3.6°C) under current policies — treating overshoot of the Paris Agreement’s 1.5°C goal as effectively locked in.
- The remaining global carbon budget for a 50% probability of staying within 1.5°C is roughly 130 gigatonnes of CO2 as of 2026 — at current annual emissions of nearly 40 GtCO2, this budget could be exhausted within approximately three years.
- Global disaster losses, including broader economic and ecological damage, already exceed $2.3 trillion annually, according to the UN’s 2026 climate report, while international climate finance reached just $136.7 billion in 2024 — a gap of well over an order of magnitude between damage and financing.
- Carbon dioxide removal (CDR) at the scale needed to return to 1.5°C will cost trillions of dollars, with per-tonne costs estimated at over $100 and ranging up to $1,000 or more depending on the removal method, according to the State of Carbon Dioxide Removal’s Third Edition (2026).
- The Fund for Responding to Loss and Damage held pledges of only around $800 million as of late 2025, a figure researchers describe as dramatically short of documented developing-country needs — underscoring the financing gap at the center of overshoot economics.
From Prevention to Management: A Deliberate Reframing
UNEP’s own annual Emissions Gap Report has tracked the shortfall between climate pledges and required pathways since 2010, but the September 2026 “Limiting Overshoot” report represents a structural change in framing rather than a change in the underlying science. Rather than treating a breach of 1.5°C as an endpoint or failure state, the report proposes an “overshoot, peak, and decline” framework: limiting the maximum level of warming reached, then working to enable a gradual return toward safer conditions over subsequent decades. As UN Secretary-General António Guterres put it in comments accompanying the report’s launch, humanity must pursue “an overshoot of ambition” — accelerating fossil fuel phaseout, slashing methane pollution, and protecting land, forests, and oceans simultaneously, rather than sequencing mitigation and adaptation as separate phases.
The report’s own numbers make clear why this reframing was considered necessary: even the most optimistic scenario incorporating all current government pledges puts expected peak warming at 1.8°C, while continuation of current policies (without stronger pledges) produces a median projection of roughly 2.6°C by century’s end, with a plausible range extending to 3.6°C. Human-induced warming is already approaching 1.4°C and increasing at roughly 0.25°C per decade — a trajectory that leaves essentially no realistic path to avoiding at least a temporary breach of the 1.5°C threshold.
The Carbon Budget Arithmetic
The remaining global carbon budget for a 50% probability of holding warming within 1.5°C stands at roughly 130 gigatonnes of CO2 as of 2026. Against current annual global emissions of nearly 40 gigatonnes, this budget could be exhausted within approximately three years at present emissions rates — a timeline that explains why the report treats exceedance as the base case for planning purposes rather than a tail risk. This arithmetic is central to why the report’s “overshoot, peak, and decline” framework requires not merely emissions reduction but active carbon dioxide removal (CDR) at scale to eventually bring atmospheric concentrations back down, rather than emissions reduction alone.
Tipping Point Risk: The Non-Linear Cost of Overshoot Duration
The UNEP report identifies four specific tipping elements where sustained warming above 1.5°C raises materially elevated risk: the West Antarctic Ice Sheet, the Greenland Ice Sheet, the Atlantic Meridional Overturning Circulation (AMOC), and the climate-biosphere system of the Amazon rainforest. Notably, the report deliberately declines to attach specific temperature thresholds to these tipping points, instead emphasizing that risk increases with both the degree and — critically for economic planning — the duration of overshoot. This duration-sensitivity is central to the report’s economic logic: the longer warming remains above 1.5°C, the greater the cumulative risk of triggering one or more of these systems, with some — such as AMOC weakening — showing model-projected recovery only on a timescale of centuries even if peak warming is later reduced.
This non-linearity matters directly for climate finance and insurance-sector risk modeling: a framework that treats overshoot duration, not just peak magnitude, as the key risk variable implies that near-term emissions reduction and carbon removal investment carry outsized value in limiting tail risk, even if 1.5°C itself is no longer avoidable as a peak.
The Financing Gap: Quantifying the Shortfall
The UN’s broader 2026 climate reporting places global disaster losses — including direct economic damage and broader ecological costs — at over $2.3 trillion annually. Against this figure, international climate finance flows reached just $136.7 billion in 2024, a gap exceeding an order of magnitude between documented damage and available financing. Climate officials have consistently framed this financing not as charitable transfer but as a protective investment against larger future losses — arguing that extreme weather, disrupted agriculture, damaged infrastructure, and displaced populations carry costs to the global economy that substantially exceed the cost of preventive action.
The financing gap is starkest in the Loss and Damage architecture specifically: the Fund for Responding to Loss and Damage held pledges of only around $800 million as of late 2025, against developing-country needs that researchers have estimated run dramatically higher — a mismatch the UNEP report explicitly identifies as an area requiring strengthened international financial commitment, particularly given the report’s emphasis on Common but Differentiated Responsibilities and Respective Capabilities (CBDR-RC) as a governing principle for how overshoot’s costs should be distributed.
The Economics of Carbon Dioxide Removal
Because the “overshoot, peak, and decline” pathway requires active carbon removal to eventually bring warming back toward 1.5°C, CDR economics have become directly material to climate finance planning in a way they were not when 1.5°C avoidance still seemed achievable through emissions reduction alone. The State of Carbon Dioxide Removal’s Third Edition (2026) estimates that many CDR approaches cost over $100 per tonne of CO2 removed, with some methods running $1,000 or more — and that deploying CDR at the annual billion-tonne scale required to meaningfully support a return to 1.5°C will cost trillions of dollars in cumulative terms, posing a genuine financial constraint on the pathway’s feasibility.
UNEP’s 2026 analysis separately and explicitly rules out solar radiation management (SRM) as a viable substitute or complement at this stage, characterizing the evidence base as limited, largely theoretical, and concentrated in a handful of countries — with significant equity implications given that SRM deployment location could produce regionally uneven climate impacts. This effectively narrows the overshoot-management toolkit to emissions reduction plus CDR, reinforcing the trillion-dollar-scale financing requirement rather than offering a lower-cost technological alternative.
Heat, Labor, and Productivity: An Underpriced Economic Risk
Beyond direct disaster losses, the UNEP report highlights heat-related productivity losses as a specific and growing economic risk channel: increasing humid heat is projected to significantly reduce outdoor labor capacity, deepening economic losses specifically in vulnerable, often lower-income countries with large outdoor and agricultural workforces. This risk channel — distinct from more visible disaster-loss categories like flooding or storm damage — represents a slower-moving but potentially larger cumulative economic cost that current climate finance flows are not clearly calibrated to address.
Implications for ESG Finance and Corporate Climate Strategy
- Adaptation finance requires a step-change, not incremental growth. The UN Secretary-General has specifically called on developed countries to triple adaptation finance and ensure it reaches those most at risk — a target that implies current adaptation financing trajectories are viewed as fundamentally inadequate given the now-explicit overshoot scenario.
- CDR investment carries genuine but expensive strategic value. With per-tonne CDR costs ranging from roughly $100 to over $1,000, ESG and climate-focused investors should differentiate between lower-cost, more scalable removal methods and premium, higher-certainty approaches when evaluating portfolio exposure to carbon removal markets.
- Loss and Damage exposure should be modeled as a growing, underfunded liability. With pledged funding around $800 million against dramatically larger documented needs, businesses operating in climate-vulnerable regions should anticipate continued political and financial pressure for expanded corporate and national contributions to this specific financing mechanism.
- Duration-sensitive tipping point risk argues for front-loaded mitigation investment. Because the UNEP framework treats overshoot duration — not just peak temperature — as the key driver of tipping-point risk, near-term mitigation spending carries a risk-reduction value that a pure peak-temperature framing would understate.
Frequently Asked Questions
Has the world already passed the 1.5°C climate threshold?
UNEP’s September 2026 report treats a temporary breach of 1.5°C as effectively locked in given current emissions trajectories, with best-case peak warming projected at 1.8°C even under optimistic government pledges, and the remaining carbon budget for a 50% chance of avoiding breach possibly exhausted within about three years.
How big is the gap between climate damage and climate finance?
Substantial — global disaster losses exceed $2.3 trillion annually according to UN 2026 reporting, while international climate finance reached only $136.7 billion in 2024, an order-of-magnitude gap between documented damage and available financing.
How much will it cost to bring warming back down to 1.5°C after overshoot?
Carbon dioxide removal at the scale needed will cost trillions of dollars cumulatively, with per-tonne costs ranging from roughly $100 to $1,000 or more depending on the removal method, according to the State of Carbon Dioxide Removal’s Third Edition (2026).
Conclusion
The UNEP’s September 2026 “Limiting Overshoot” report represents a genuine inflection point in climate policy framing — an acknowledgment that 1.5°C avoidance is no longer the operative planning assumption, replaced by a more complex “overshoot, peak, and decline” pathway with its own distinct, quantifiable economics. For climate finance, ESG investment strategy, and corporate risk planning, the practical implications are concrete: a financing gap measured in trillions rather than billions, a carbon removal market that must scale to unprecedented size at meaningful cost, and a tipping-point risk profile where the duration of overshoot — not merely its peak — will determine how much of this economic cost becomes irreversible.

The Pentagon rarely uses the word “unrecoverable” in an official acquisition report. It used it this August, in a Selected Acquisition Report describing the state of Boeing’s F-15EX Eagle II program — and the phrase should have every defense-sector supply chain manager, procurement officer, and B2B logistics executive paying close attention.
The core problem: a 102-day strike at Boeing’s St. Louis-area production facilities didn’t just cost the company three months of output. It broke a delivery schedule in a way the Pentagon itself now says can’t be fully undone.
The Aircraft: What the F-15EX Actually Delivers
Before the supply chain story, it’s worth understanding why the Air Force wants this jet badly enough to be publicly frustrated about delays.
The F-15EX Eagle II is the most advanced variant of the F-15 lineage ever built:
- Digital fly-by-wire flight controls and a large-area glass cockpit with touchscreen interface
- A new APG-82 AESA radar, Joint Helmet Mounted Cueing System, and EPAWSS self-defense electronic warfare suite
- Higher speed and longer range than legacy F-15 variants, with a 29,000-lb payload capacity across additional weapons stations versus older Eagles
- A per-unit flyaway cost of roughly $90–93 million, with a 30-year, 104-jet program lifecycle cost estimated at $30–35 billion — a figure that compares favorably to stealth alternatives on a pure cost basis
The Air Force has committed to replacing aging F-15C/D fleets — including 36 jets slated to permanently replace 48 legacy Eagles at Kadena Air Base, Okinawa — with the EX variant, making this as much an Indo-Pacific readiness story as a domestic manufacturing one.
The Strike: 102 Days That Broke a Production Curve
Roughly 3,000+ Boeing machinists in the St. Louis region — spanning facilities in St. Louis, St. Charles, and Mascoutah, Illinois — walked off the job on August 4, 2025. The strike didn’t end until November 13–17, 2025, a complete production halt of more than three months.
Before the walkout, Boeing’s plan was aggressive but achievable:
- Deliver a full dozen Lot 2 Eagle IIs by the end of calendar 2025
- Ramp to an assembly rate of two jets per month by early 2026
- Maintain the program’s prior track record of staying within cost, schedule, and performance baselines — with all Lot 1 aircraft already delivered on time
The strike erased that runway entirely. Then–Air Force chief of staff nominee Gen. Kenneth Wilsbach confirmed the delay in written Senate testimony well before the strike even ended, warning lawmakers that overseas deliveries — including to Kadena — would be pushed into 2026.
Why the Pentagon Called the Slip “Unrecoverable”
Here’s the detail that separates this piece from standard defense-news coverage: the August 2026 Selected Acquisition Report doesn’t just describe a delay — it describes a structural, non-recoverable schedule slip.
- Boeing’s original contract required all 12 Lot 3 jets delivered in early calendar 2026.
- Instead, only about six will arrive by year’s end.
- The report explicitly frames this shortfall as permanent — the missed units are not simply “coming later,” they represent lost production capacity the line cannot make up under current constraints.
The Real Bottleneck: Parts Shortages Compounding the Strike
This is the angle that pure aviation-hobbyist coverage tends to skip, but that matters enormously to defense-sector procurement and supply chain software buyers: the strike exposed — and worsened — a parts shortage that predates it.
- Elbit-built large-area displays and low-profile head-up displays, which give the Eagle II its signature glass cockpit, are running short.
- General Electric F110 engines, the powerplant behind the jet’s performance envelope, face their own allocation constraints.
- Collins-made ejection seat cartridges round out the list of critical, single-source components.
Stockpiled inventory built up before the strike was sufficient to cover Lot 1B production. Everything after that is exposed. The Pentagon has resorted to borrowing-and-payback arrangements with foreign military sales customers — essentially reallocating parts earmarked for allied buyers back to U.S. production lines, then repaying the debt later — just to keep the line moving. That’s not a sustainable long-term fix; it’s a stopgap that shifts risk onto allied delivery schedules instead of eliminating it.
What This Means for Defense Contractors and Suppliers
For B2B readers in the defense and aerospace supply chain space, the actionable takeaways are:
- Single-source component risk is now a headline Pentagon concern, not a theoretical one. Any supplier or integrator still running single-vendor sourcing on flight-critical components (displays, engines, ejection systems) should expect increased scrutiny — and increased opportunity for qualified second-source suppliers.
- Supply chain visibility software and multi-tier risk modeling tools are likely to see increased defense-sector procurement interest as primes try to avoid a repeat of the Elbit/GE bottleneck on other programs.
- Labor relations at unionized aerospace primes are now a directly quantifiable program risk, one the Pentagon is willing to describe in a public acquisition document. Expect this to influence how future defense contracts price in labor-disruption contingencies.
- The F-15EX buy itself may be doubling in size even as the current lots run behind — the same Selected Acquisition Report flagged new cost and schedule uncertainty tied to an expanded production run, including warnings that radar, mission computer, electronic warfare, and engine systems could become obsolete over a longer timeline, requiring a “significant redesign effort” whose full cost hasn’t yet been estimated.
What Competitors Are Missing
Most defense trade coverage of the F-15EX delays stopped reporting once the strike itself ended in November 2025. The more important story — the one buried in an August 2026 acquisition document most outlets haven’t dug into — is that the schedule damage from that strike is now classified by the Pentagon as permanent, and that a second, ongoing bottleneck (Elbit displays and GE F110 engines) means the program isn’t fully back to healthy even ten months after the picket lines came down.
Timeline at a Glance
- Aug. 4, 2025 — St. Louis strike begins
- Oct. 2025 — Wilsbach confirms delivery delays in Senate testimony
- Nov. 13–17, 2025 — Strike ends
- Nov. 26, 2025 — First post-strike F-15EX delivered (142nd Wing, Portland ANG)
- Feb. 2026 — Air Force confirms delayed Kadena Air Base deployment
- Apr.–Jun. 2026 — Boeing targets doubling production rate to two jets/month
- Aug. 2026 — Selected Acquisition Report flags “unrecoverable delays” and parts shortages
People also Ask :
Q: Why are F-15EX Eagle II deliveries delayed?
A 102-day strike at Boeing’s St. Louis-area facilities (August–November 2025) halted F-15EX production, and a 2026 Pentagon acquisition report calls the resulting schedule slip “unrecoverable” — only about six of the contracted 12 Lot 3 jets will arrive by the end of 2026 instead of all 12 in early 2026. Ongoing shortages of Elbit-built cockpit displays and GE F110 engines are compounding the delay.
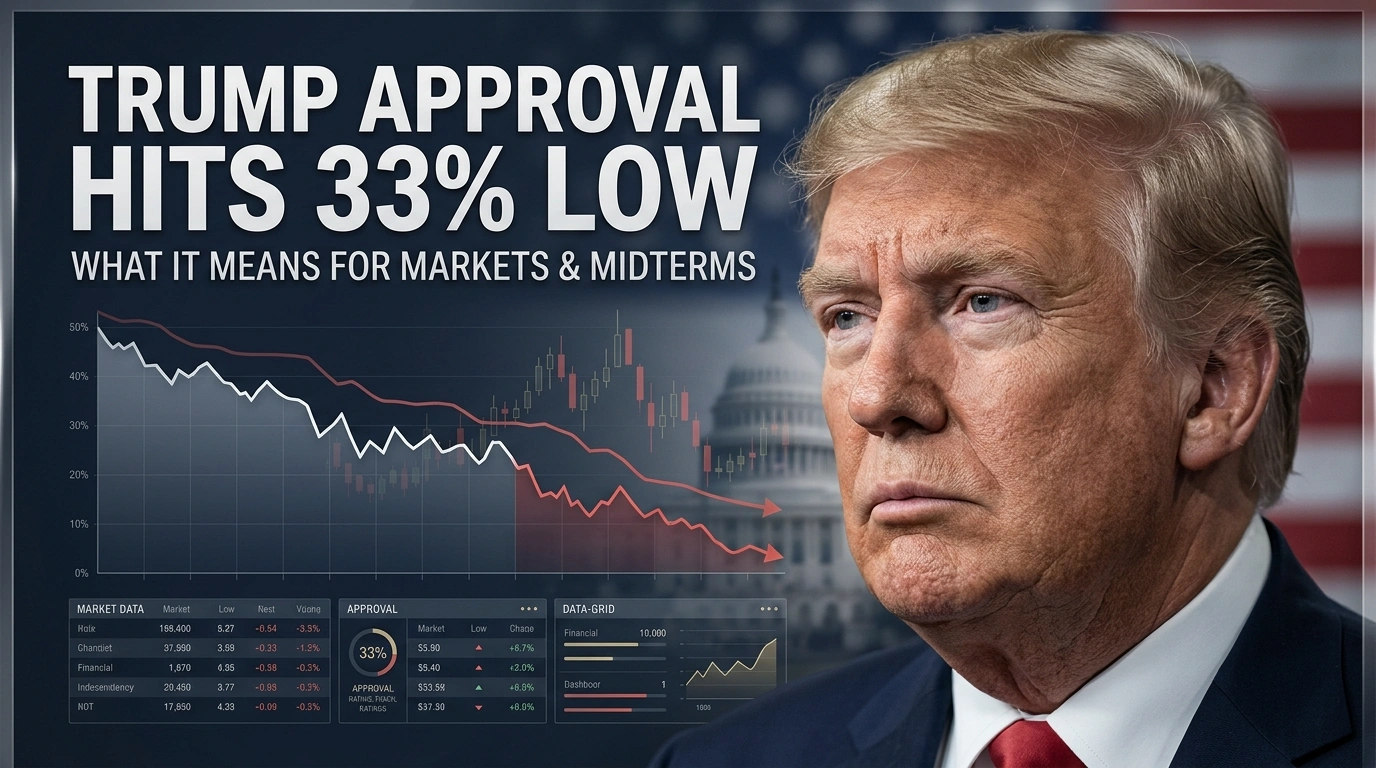
Trump’s approval rating has hit a second-term low of 33% in multiple polls this summer. Here’s what’s driving the decline, how it compares historically, and what it could mean for markets and the 2026 midterms.
Key Takeaways
- Trump’s approval rating has hit 33% in multiple independent polls this summer, including Reuters/Ipsos, The Economist/YouGov, and AP-NORC — a new low for his second term.
- The decline has been steep: Reuters/Ipsos polling shows a 14-point slide from 47% at the start of his second term to 33% now, with disapproval climbing from 41% to 65%.
- Polling averages remain somewhat higher than the lowest individual polls — the Decision Desk HQ average stood at 39.2%, illustrating the spread between different methodologies.
- The unpopular Iran conflict is a major drag: only 31% of Americans support continued U.S. military action, and 83% believe the conflict will continue for an extended period.
- Historical comparison is unfavorable: Trump’s current numbers trail his own first-term approval at the same point (41% in 2018) and are also below Biden’s comparable second-year approval (40% in August 2022).
Breaking Down the Numbers
Multiple independent polling organizations have converged on a similar, unflattering picture of President Trump’s standing heading into the 2026 midterms:
- Reuters/Ipsos: 33% approval, 65% disapproval (held steady across two consecutive surveys in mid-to-late August)
- The Economist/YouGov: 33% approval, a new low for that poll as of late August
- AP-NORC: 33% approval in a late-July survey — three points below Biden’s July 2022 approval and eight points below Trump’s own first-term July numbers
- Decision Desk HQ (DDHQ) average: 39.2%, the second-lowest since May, with 57.5% disapproving
The gap between the lowest individual polls (33%) and the polling average (around 39%) is a useful reminder for anyone tracking this story: individual polls can diverge meaningfully from methodology to methodology, and averages tend to smooth out the noise. Still, the consistent direction across virtually every major pollster — down, not up — is the more important signal than any single data point.
The Trajectory Matters as Much as the Level
According to Reuters/Ipsos tracking, Trump’s approval has fallen 14 points since the start of his second term, from 47% down to 33%, while disapproval has climbed 24 points, from 41% to 65%. That’s a significant and sustained erosion, not a single bad news cycle.
What’s Driving the Decline?
1. The Iran Conflict
An unpopular and prolonged U.S. military engagement with Iran is a significant drag on approval numbers:
- Only 31% of Americans support continued U.S. military action in Iran, down from 34% earlier in the summer and 37% in March.
- 83% of Americans believe the conflict will continue “for an extended period,” up from 80% earlier in the month — suggesting fatigue is building rather than easing.
- Approval of Trump’s handling of the Iran conflict specifically has declined even among Republicans, dropping from 71% to 61% in recent tracking, with just 48% of Republicans saying the U.S. should continue military action.
2. Economic Concerns
Polling context around the approval decline points to persistent economic anxiety among Americans as a contributing factor, compounding the foreign policy drag.
3. Historical Second-Term Pattern
Trump’s approval trajectory now trails not just his own first term, but also recent predecessors at comparable points:
| President | Approval at Comparable Point | Source |
|---|---|---|
| Trump (2026, second term) | 33% | Reuters/Ipsos |
| Trump (2018, first term, midterm year) | 41% | Reuters/Ipsos |
| Biden (August 2022) | 40% | Reuters/Ipsos |
Historical Context: What Happened Last Time Approval Was This Low Before a Midterm?
In the 2018 midterms — when Trump’s approval stood around 41%, notably higher than his current 33% — Republicans lost control of the House of Representatives, though the party gained two Senate seats. With his current approval running meaningfully below that benchmark, political analysts and Republican strategists are expressing heightened concern about the party’s ability to defend its congressional majorities in 2026.
Market and Investment Implications
Political Risk and Sector Exposure
Historically, periods of declining presidential approval heading into a midterm election can correlate with:
- Increased policy uncertainty premium in markets, particularly for sectors sensitive to potential legislative gridlock or shifts in regulatory posture.
- Elevated volatility in sectors tied to trade and foreign policy, given the Iran conflict’s direct role in the approval decline.
- Currency and bond market sensitivity to shifting expectations about fiscal policy continuity, particularly if control of Congress appears increasingly contested.
What History Suggests About Midterm-Year Market Performance
Markets have historically shown resilience through midterm election cycles regardless of which party is expected to gain seats, often pricing in political uncertainty well ahead of the actual vote. That said, sectors with direct regulatory or fiscal exposure — energy, defense, financial services, and healthcare — tend to see the most direct repricing around shifting congressional control expectations.
Actionable Takeaways for Investors and Political Observers
- Don’t overreact to a single poll. The spread between individual polls (33%) and polling averages (around 39%) illustrates why tracking multiple pollsters and trend direction matters more than any single headline number.
- Watch the Iran conflict closely as a specific, trackable driver of both approval numbers and potential market volatility — any de-escalation or further escalation is likely to move both simultaneously.
- Consider portfolio hedging strategies around sectors with direct regulatory exposure if you expect a competitive midterm environment to increase legislative gridlock risk.
- Track generic congressional ballot polling alongside presidential approval, as it offers a more direct read on likely House and Senate outcomes than approval ratings alone.
- Maintain a diversified portfolio rather than making concentrated bets based on political forecasting, given the inherent uncertainty in translating approval polling into specific electoral or market outcomes.
Frequently Asked Questions
What is Trump’s current approval rating? Multiple polls, including Reuters/Ipsos, The Economist/YouGov, and AP-NORC, have shown Trump’s approval rating at 33% as of late August 2026, while broader polling averages like Decision Desk HQ’s show a somewhat higher figure around 39%, reflecting the spread across different polling methodologies.
Why has Trump’s approval rating declined so much in 2026? Polling data points to an unpopular and prolonged U.S. military conflict with Iran, with only 31% of Americans supporting continued military action, alongside broader economic concerns, as significant contributing factors to the decline from 47% approval at the start of his second term to 33% now.
How might low presidential approval affect the stock market ahead of the midterms? Markets have historically shown general resilience through midterm election cycles, but sectors with direct regulatory or fiscal policy exposure — such as energy, defense, financial services, and healthcare — tend to experience more direct volatility around shifting expectations for congressional control, so investors may want to monitor generic ballot polling alongside approval ratings.

Climate Finance and the Economic Reality of Passing 1.5°C

Business Insurance for Digital Exports: Protecting Your Company in the AI Era

Real Estate Crash Predictions 2026: Data-Backed Regional Guide
Unrecoverable Delays: How the St. Louis Strike Crippled Boeing’s F-15EX Eagle II

What is a “Lead-Left” Bank? Unpacking Morgan Stanley’s Role in Anthropic’s Mega-IPO

How to Invest in the Anthropic IPO: Step-by-Step Guide for Retail Investors

Mario Kart 8 Deluxe 4.0.0 Patch Notes: 8-Player Split Screen & CameraPlay

Is SPY Overvalued in September 2026? Fed Rate Hike Odds & Intrinsic Value
Intel 18A Foundry Strategy 2027: Capital Burn, Stock Sales & Break-Even Timeline
Trump Approval Hits 33% Low: What It Means for Markets & Midterms

Crypto Trading: Why AI Tools Are Changing Gen Z Investing

AI Creator Deals: How Contracts Protect Influencers

Gen Z AI Skills: Online Degrees That Boost Job Prospects

AI Automation Tools Transform Gen Z Creator Careers

Pakistan’s KSE-100 Nears Record Territory Even as the Trade Gap Persists

US Consumer Sentiment Sinks as Retail Sales Drop

Barclays Q2 2026 Results: Income Beats, Costs Rise 7%

Pakistan’s Remittance Lifeline: Why Gulf Exposure Is a Hidden Risk

Dubai’s Rise to the World’s 7th Financial Hub: Inside the D33 Push

China EV Exports Hit Record High in 2026

Top 15 Stocks for Investment in 2026 in PSX: Your Complete Guide to Pakistan’s Best Investment Opportunities

Debunking IMF Program Myths: Reconfiguring Engagement for True National Ownership in a Volatile World

Top 10 Mutual Fund Managers in Pakistan for Investment in 2026: A Comprehensive Guide for Optimal Returns
What the U.S. Attack on Venezuela Could Mean for Oil and Canadian Crude Exports: The Economic Impact

China’s 50% Domestic Equipment Rule: The Semiconductor Mandate Reshaping Global Tech

15 Most Lucrative Sectors for Investment in Pakistan: A 2025 Data-Driven Analysis

Pakistan’s Export Goldmine: 10 Game-Changing Markets Where Pakistani Businesses Are Winning Big in 2025

Pakistan’s Stock Market Renaissance: How 2025’s Hottest Investment Opportunity Is Democratizing Wealth—A Complete Beginner’s Guide
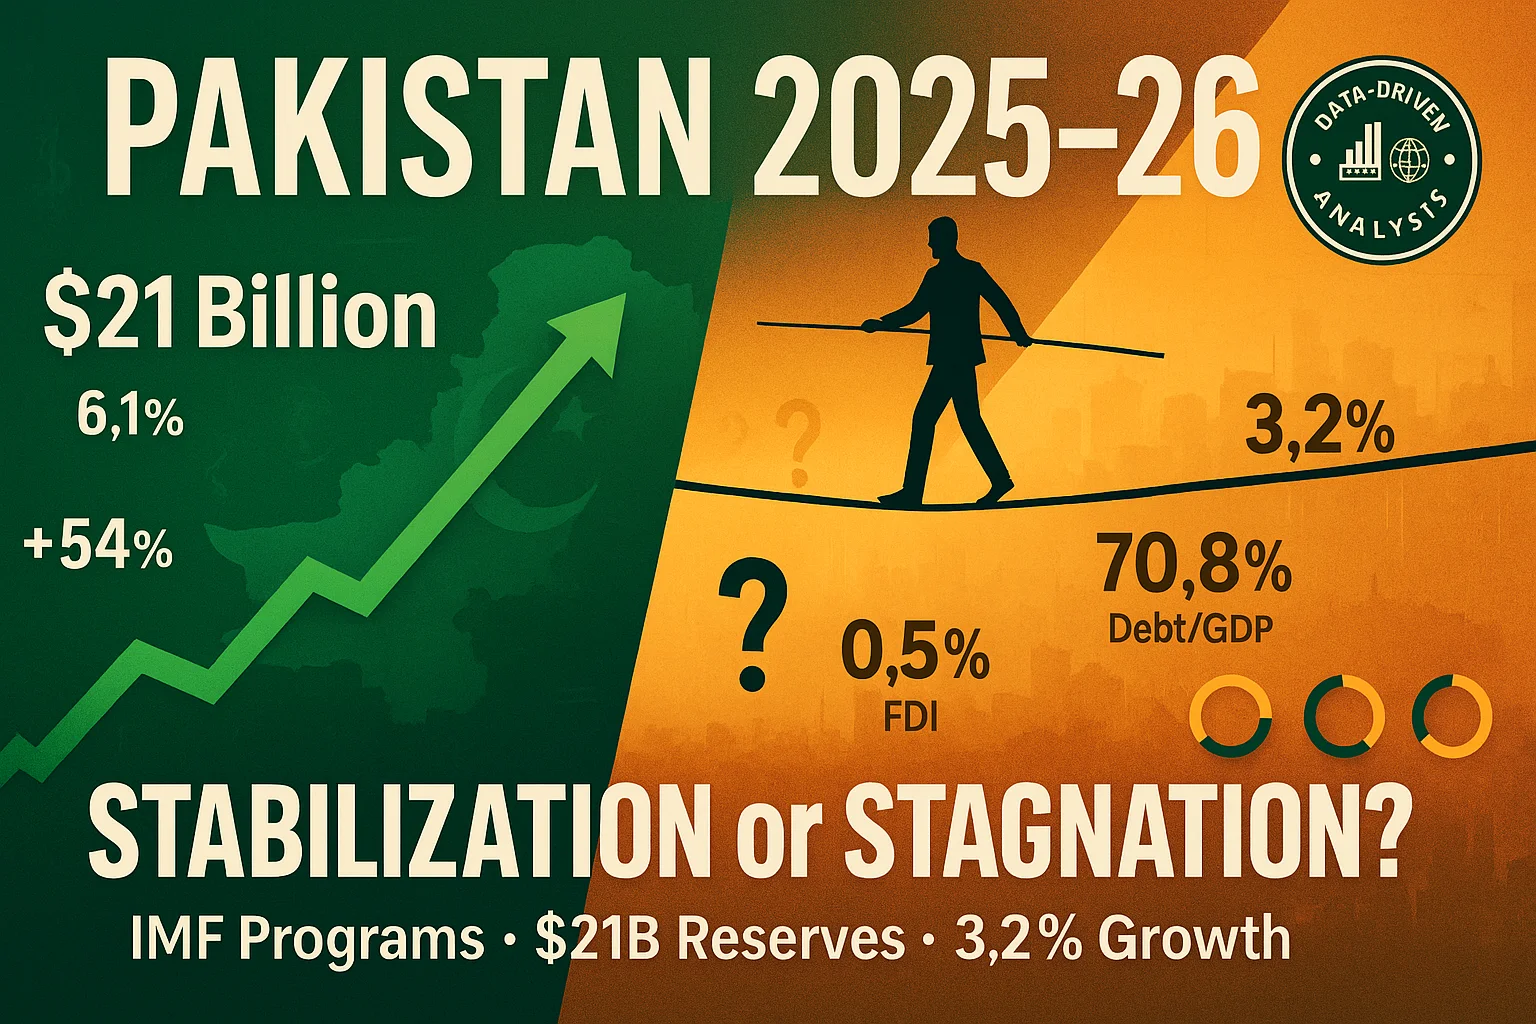
Pakistan’s Economic Outlook 2025: Between Stabilization and the Shadow of Stagnation
China’s Property Woes Could Last Until 2030—Despite Beijing’s Best Censorship Efforts

Best Investments in Pakistan 2026: Top 10 Low-Price Shares and Long-Term Picks for the PSX

How to Become an Active Taxpayer on Pakistan’s FBR Active Taxpayer List (ATL) in 2026: A Step-by-Step Guide

The Contours of 21st-Century Geopolitics Will Become Clearer in 2026: A New World Is Starting to Emerge

🌍 Davos 2026: The World Economic Forum Annual Meeting Sets the Stage for Global Transformation

The Institutional Era: A Comprehensive Cryptocurrency Investment Analysis for 2026

The New Executive Gold Standard: Top 10 Companies Lavishing Unprecedented Perks on CEOs and CFOs in 2025–2026

After Four Decades of Decline, Can Private Ownership Save Pakistan’s National Airline?
DBS Hits S$1 Billion AI Value Milestone — But Agentic AI Poses Talent Challenges for Singapore Banks
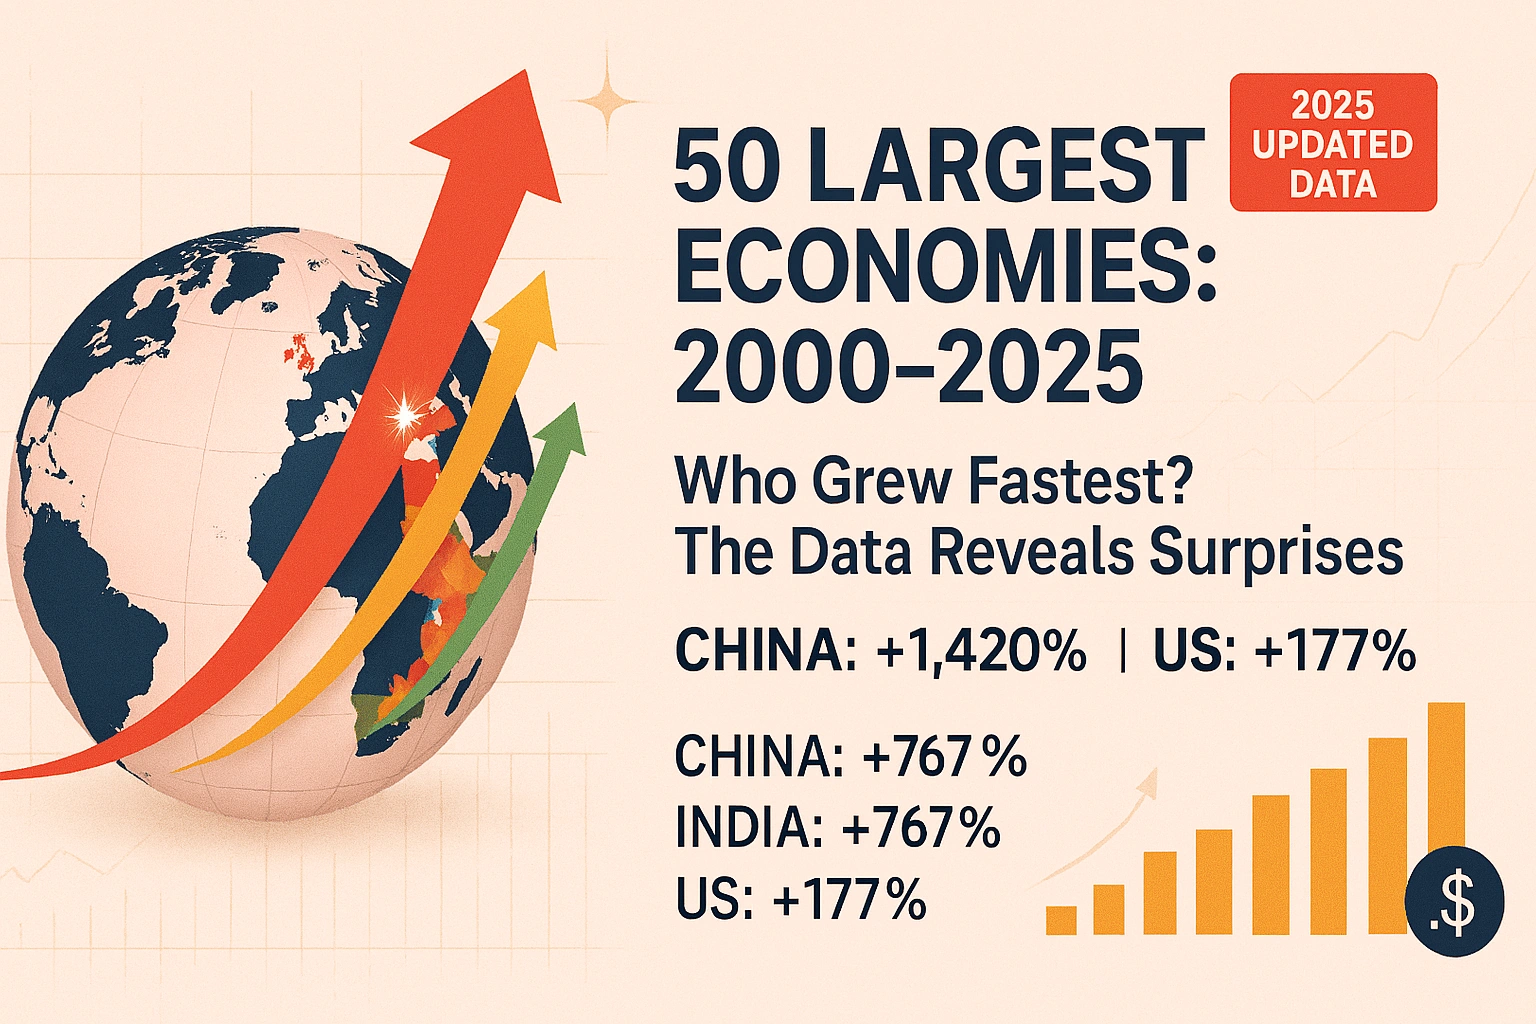
The World’s 50 Largest Economies: A 25-Year Growth Trajectory Analysis (2000-2025)

Resource Wealth and Geopolitical Vulnerability: Understanding Recent US Foreign Policy Toward Venezuela, Greenland, and Iran
-
Markets & Finance8 months ago
Top 15 Stocks for Investment in 2026 in PSX: Your Complete Guide to Pakistan’s Best Investment Opportunities
-
Analysis7 months ago
Debunking IMF Program Myths: Reconfiguring Engagement for True National Ownership in a Volatile World
-
Investment8 months ago
Top 10 Mutual Fund Managers in Pakistan for Investment in 2026: A Comprehensive Guide for Optimal Returns
-
Global Economy8 months ago
What the U.S. Attack on Venezuela Could Mean for Oil and Canadian Crude Exports: The Economic Impact
-
Asia8 months ago
China’s 50% Domestic Equipment Rule: The Semiconductor Mandate Reshaping Global Tech
-
AI8 months ago
15 Most Lucrative Sectors for Investment in Pakistan: A 2025 Data-Driven Analysis
-
Exports8 months ago
Pakistan’s Export Goldmine: 10 Game-Changing Markets Where Pakistani Businesses Are Winning Big in 2025
-
Global Economy9 months ago
Pakistan’s Stock Market Renaissance: How 2025’s Hottest Investment Opportunity Is Democratizing Wealth—A Complete Beginner’s Guide