
Markets & Finance
Life Insurance Comparison: Term vs. Whole Life and What Each Actually Costs


A 40-year-old buying $500,000 in term life coverage pays roughly $26 a month — the same coverage as a whole life policy can cost over $200 a month for the identical death benefit, a gap most first-time shoppers never see clearly explained before they buy.
Life insurance comparison shopping isn’t just about finding the cheapest insurer — it’s about understanding which fundamentally different type of policy actually fits your financial situation, since term and permanent life insurance solve very different problems at dramatically different price points. Getting this choice wrong is one of the most expensive and hardest-to-reverse mistakes in personal finance.
This guide breaks down how term and whole life insurance actually compare, current 2026 rate benchmarks by age and policy type, and how to choose between them.
How Term and Whole Life Insurance Actually Compare
The fundamental distinction is duration and structure: term life covers you for a fixed period with no cash value, while whole life covers you permanently and builds a cash value component — and that structural difference explains nearly the entire price gap between them.
Key takeaway: A 40-year-old man in good health who doesn’t smoke may pay less than $20 per month for a 20-year, $250,000 term life policy, but $216 per month for a whole life policy with the same coverage amount — meaning the permanent policy costs roughly 10 times more for identical death benefit coverage.
Term Life Insurance: What It Is and Isn’t
- Covers a fixed period — commonly 10, 20, or 30 years — and pays a death benefit only if you die during that term.
- Builds no cash value — the policy simply expires if you outlive the term, with no residual value.
- Significantly cheaper — because most term policies never pay out, premiums stay low relative to the coverage amount.
- Best suited to temporary needs — replacing income during child-rearing years, covering a mortgage term, or protecting a co-signed debt.
Whole Life Insurance: What It Is and Isn’t
- Covers your entire lifetime, as long as premiums are paid, with a guaranteed death benefit.
- Builds cash value over time, which grows tax-deferred and can be borrowed against or withdrawn.
- Premiums are fixed for life and, unlike term policies, never increase once the policy is issued.
- Best suited to permanent needs — estate planning, funding a lifetime dependent’s care, or as a component of a broader wealth-transfer strategy.
Step-by-Step: How to Compare Life Insurance Quotes
- Determine how long you actually need coverage — a temporary need (mortgage, income replacement until kids are grown) points toward term; a permanent need points toward whole or universal life.
- Decide on a coverage amount based on income replacement needs, outstanding debts, and dependents’ future expenses.
- Get quotes for the same coverage amount and term length across at least three insurers, since pricing varies meaningfully by carrier even for identical applicant profiles.
- Compare riders and policy features — child riders, disability waivers, and conversion options can meaningfully affect long-term value.
- Review the insurer’s financial strength rating, since a life insurance promise is only as good as the company’s ability to pay decades from now.
- Complete the underwriting process honestly — medical exams and health disclosures directly determine your final rate, and misrepresentation can void a claim later.
Financial and Strategic Implications: 2026 Rate Benchmarks by Age
Rates rise substantially with age for both policy types, making early purchase one of the most effective ways to minimize lifetime insurance costs.
| Age | Term Life (Men, Annual) | Term Life (Women, Annual) | Whole Life (Men, Annual) | Whole Life (Women, Annual) |
|---|---|---|---|---|
| 20 | $749 | $554 | $2,548 | $2,260 |
| 30 | $795 | $645 | $3,662 | $3,292 |
| 40 | $1,482 | $1,175 | $5,524 | $4,967 |
| 50 | $3,495 | $2,560 | $8,749 | $7,782 |
| 60 | $8,435 | $6,002 | $14,517 | $12,670 |
Rates based on a $500,000 policy for preferred nonsmoker applicants in good health; NerdWallet 2026 data.
Expert insight: Whole life premiums typically increase by 8% to 10% for every additional year of age at the time of application, meaning the cost of waiting even a few years to purchase permanent coverage compounds meaningfully — a strong argument for locking in a policy earlier rather than later if permanent coverage genuinely fits your needs.
Factors That Legally Cannot Affect Your Rate
Insurers cannot base your life insurance rate on ethnicity, race, or sexual orientation, and generally do not use credit score as a rating factor the way auto and home insurers do — rates are instead driven primarily by age, gender, health status, tobacco use, and the coverage amount and term length selected.
How to Choose Between Term and Whole Life Insurance
- Match the policy to the actual financial need, not to the policy that feels the most “permanent” or reassuring — a temporary income-replacement need is almost always better served by lower-cost term coverage.
- Consider term conversion options — many term policies allow conversion to permanent coverage later without new medical underwriting, offering flexibility without paying whole life premiums upfront.
- Don’t conflate life insurance with investment strategy — while whole life builds cash value, the returns are typically modest compared to dedicated investment vehicles, meaning “insurance as an investment” pitches deserve careful independent scrutiny.
- Buy coverage while young and healthy — since both term and whole life rates increase substantially with age, delaying a purchase you already know you need has a real, compounding cost.
- Compare quotes from multiple insurers for the same coverage, since rate variation between carriers for identical applicant profiles can be substantial.
- Add a term rider to a whole life policy, rather than buying an all-whole-life solution, as a way to secure higher total coverage during high-need years (young children, a large mortgage) without paying permanent-policy rates on the full amount.
Key takeaway: The most common and costly life insurance mistake isn’t choosing the wrong company — it’s buying a policy type that doesn’t match the actual duration of the financial need, paying permanent-policy premiums for what is really a temporary coverage requirement, or vice versa.
Future Outlook: Life Insurance Trends Through 2027
- Digital underwriting continues to compress application timelines. More insurers now offer accelerated underwriting using health data and prescription history instead of a traditional medical exam for qualifying applicants, meaningfully speeding up the quote-to-policy timeline for healthy applicants.
- Term insurance affordability remains historically favorable. Term rates have stayed relatively stable in recent years, keeping the cost gap between term and permanent coverage wide and reinforcing term’s role as the default choice for most temporary coverage needs.
- Hybrid life-and-long-term-care products are gaining attention. As long-term care costs continue rising, more insurers are marketing permanent life policies with long-term care riders, an area worth independent comparison against standalone long-term care insurance.
- Life insurance adoption gaps persist as an ongoing industry concern. Despite historically low term insurance costs relative to coverage amount, a significant share of households remain underinsured or uninsured, keeping consumer education a continued focus for insurers and regulators alike.
Frequently Asked Questions
What’s the main difference between term and whole life insurance? Term life covers you for a fixed period with no cash value and lower premiums; whole life covers you permanently, builds cash value, and costs substantially more for the same death benefit.
Which is cheaper, term or whole life insurance?
Term life is significantly cheaper — a 40-year-old might pay under $20 a month for term coverage versus over $200 a month for a whole life policy with the same death benefit.
Does my credit score affect my life insurance rate?
Generally no. Unlike auto or home insurance, life insurers typically do not use credit score as a rating factor; rates are driven mainly by age, gender, health, and tobacco use.
Can I convert a term life policy to whole life later?
Many term policies include a conversion option allowing you to switch to permanent coverage later without new medical underwriting, though this should be confirmed at the time of purchase since not all policies include it.
How much does life insurance typically cost per month?
Costs vary widely by age, health, and policy type, but a healthy 40-year-old might pay roughly $26 a month for a standard 20-year, $500,000 term policy, according to industry averages.






Economy & Markets
Stock Market Today: Nasdaq Hits Record High as Dow and S&P 500 Stumble on Middle East Diplomatic Shifts

While the broader market struggled to find a definitive direction on September 23, 2026, the tech-heavy Nasdaq Composite secured another record close. Investors continue to exhibit a voracious appetite for artificial intelligence (AI) and semiconductor stocks, viewing them as long-term structural winners despite underlying macroeconomic crosscurrents.
Meanwhile, the Dow Jones Industrial Average and the S&P 500 failed to catch the tech sector’s tailwind, pressured by sliding oil prices and a rotation out of traditional blue-chip sectors.
Key Market Takeaways
- Nasdaq Extends AI-Fueled Rally: The index surged to a fresh record closing high, fueled by continued momentum in high-performance chipmakers and mega-cap tech stocks.
- Dow Jones & S&P 500 Lag: The Dow shed over 185 points, while the S&P 500 ended flat as investors rotated out of industrial and energy names.
- Oil Prices Slip Below $100: Global crude benchmarks pulled back sharply following productive U.S.-Iran diplomatic discussions at the United Nations.
- Bond Yields Stabilize: The 10-year Treasury yield cooled slightly, slipping back under the critical 5% threshold, offering relief to rate-sensitive equities.
Major Index Performance (September 23, 2026)
| Index | Closing Price | Point Change | Percentage Change |
| Nasdaq Composite | 27,244.28 | +121.15 | +0.45% |
| S&P 500 | 7,764.27 | -0.43 | -0.01% |
| Dow Jones Industrial Average | 51,863.69 | -185.14 | -0.36% |
Tech Leads the Charge While the Dow Drifts
The divergence between high-growth technology and cyclical sectors was the defining narrative of the session. According to market data analyzed by Zacks Investment Research, the Information Technology Select Sector SPDR (XLK) rose 0.7%, masking broader weaknesses in the market.
Semiconductor companies carried the bulk of the index’s weight. High-performance power chipmaker Monolithic Power Systems (MPWR) jumped over 8%, while industry stalwarts like Micron, Nvidia, and Advanced Micro Devices (AMD) all contributed to the upward momentum.
Conversely, the Dow Jones Industrial Average dropped 0.36%, weighed down by lagging industrial stocks and banking financials like JPMorgan Chase and Wells Fargo. The S&P 500 finished effectively flat, reflecting an aggressive tug-of-war between soaring tech valuations and struggling traditional sectors.
Crude Oil Slides Amidst U.S.-Iran Diplomatic Progress
Energy markets commanded outsized attention as both Brent and West Texas Intermediate (WTI) crude experienced notable declines. Brent crude slipped back below the psychological $100-per-barrel mark, settling near $98.68, while WTI fell toward $89.64.
The primary catalyst for the selloff was a geopolitical de-escalation signal. As reported by BNN Bloomberg, diplomatic progress during “very good” meetings between U.S. and Iranian officials at the UN General Assembly helped soothe global energy supply anxieties. This geopolitical cooling temporarily offset supply-side fears stemming from a recent armed blockade at Libya’s El Sharara oil field.
Treasury Yields Cool, Easing Pressure on Equities
Bond markets provided a much-needed tailwind for growth stocks, acting as a counterbalance to the broader economic uncertainty. The benchmark 10-year U.S. Treasury yield touched an intraday high of 4.98% on hawkish Federal Reserve commentary before retreating back to hover near 4.94% by the close.
Falling oil prices naturally provide relief from the inflation and interest rate concerns that have dominated September trading, as highlighted by TheStreet. Stable borrowing costs help keep mortgage rates and corporate debt manageable, granting investors the confidence to bid up valuations in long-duration tech assets.
What to Watch Next
As Wall Street digests Wednesday’s split-market action, institutional focus is pivoting toward critical upcoming macroeconomic and corporate events:
- U.S.-China Summit: A highly anticipated meeting in Washington, D.C., later this week could yield progress on a trade truce and potentially spark new bilateral frameworks for global AI regulation.
- Corporate Earnings: Paychex (PAYX) and Cintas (CTAS) will provide fresh insights into small-business payroll trends and broad corporate hiring, giving investors a real-time read on the health of the U.S. labor market. Retail bellwether Costco Wholesale (COST) is also slated to report on Thursday, which will serve as a barometer for big-ticket consumer demand.
Economy & Markets
Energy Market Spikes vs. Consumer App Data: What GasBuddy and Crude Prices Signal for Inflation

Gasoline rose 3.9% in August and drove over a third of the CPI increase. Inside the crude-to-pump-to-CPI chain and what it means for the next Fed decision.There is a clean, traceable chain running from a Saudi pipeline to a Bureau of Labor Statistics table, and August 2026 is the cleanest illustration of it in years.
Executive Summary / Key Takeaways
- The August 2026 CPI, released 11 September, showed the all-items index up 0.4% on the month and 3.4% over twelve months.
- The gasoline index rose 3.9% in August, accounting for over one third of the entire monthly all-items increase. Energy overall rose 2.1% after falling 1.5% in July.
- Year-on-year, gasoline was up 27.4% and fuel oil up 52%, while energy as a whole rose 16.3%.
- Core CPI, excluding food and energy, rose 0.3% on the month but slowed to 2.4% annually — the lowest reading since March 2021.
- The divergence is the signal: headline inflation is being generated almost entirely by energy while underlying price pressure cools. That is the precise configuration that makes a supply-shock tightening cycle contentious.
The Consumer Price Index rose 0.4% month-on-month in August, meeting consensus, and held at 3.4% on a twelve-month basis, per TD Economics. Energy costs rose 2.1% monthly, led by a 3.9% gain in gasoline. Food rose a subdued 0.1% for a second consecutive month and is up 2.7% over the year. Excluding food and energy, core prices rose 0.3% monthly — a tick hotter than expectations — while the twelve-month core rate edged down to 2.4%, with the three-month annualised at a softer 2.0%.
The BLS itself flagged the concentration: the gasoline index accounted for over one third of the monthly all-items increase.
2. Core Analysis: The Transmission Chain
2.1 August CPI in detail
| Component | Monthly change | Annual change | Note |
|---|---|---|---|
| All items | +0.4% | +3.4% | Strongest monthly rise in three months |
| Core (ex food & energy) | +0.3% | +2.4% | Lowest annual reading since March 2021 |
| Gasoline | +3.9% | +27.4% | Over one-third of the monthly headline increase |
| Energy (all) | +2.1% | +16.3% | After -1.5% in July |
| Fuel oil | +10.1% | +52.0% | Sharpest annual move in the report |
| Electricity | -0.2% | +3.8% | Declined monthly |
| Natural gas | -1.1% | — | Declined monthly |
| Shelter | +0.3% | +3.0% | Eased from 3.2% |
| Food | +0.1% | +2.7% | Eased from 3.0% |
| Airline fares | +2.7% | — | Fuel pass-through visible |
Data compiled from the BLS release, Trading Economics and Fox Business reporting.
2.2 Crude to pump to CPI
The chain has three links and a measurable lag at each.
Crude to pump. Crude is the largest single cost in a gallon of gasoline, and pump prices generally track WTI and Brent with a one-to-two week lag. WTI has traded near $103 and Brent near $107, following Houthi attacks that shut a crucial Saudi crude pipeline bypassing the Strait of Hormuz.
Pump to CPI. The BLS surveys consumer prices up to the previous month, so the August report published on 11 September reflects August pump prices — which averaged well below the $4.329 recorded on 15 September, per AAA data. Real-time retail fuel readings therefore lead the gasoline index by roughly four to six weeks.
CPI to policy. The August report showed inflation remaining elevated on rising energy prices, which Vanguard senior economist Josh Hirt said made a September rate hike more likely, per Fox Business. The Fed hiked on 16 September.
That is the full loop, and it took roughly six weeks from pipeline to policy decision.
2.3 Why headline and core diverged
Core inflation falling to 2.4% — its lowest since March 2021 — while headline holds at 3.4% is the most consequential detail in the release, and most coverage buried it.
Core below headline means energy is the primary driver and underlying price pressures are cooling. Shelter, the largest single CPI component, rose a comparatively modest 0.3% monthly and 3.0% annually, elevated historically but not accelerating the way energy is, per analysis of the release. Used vehicle prices are essentially flat year-on-year at +0.4% and new vehicles up only 0.6%, meaning that outside gasoline, transportation is not an inflation driver at all.
Headline is also well off its peak. The 3.4% annual rate is down from the April 2026 peak of 4.2%.
3. Structural Drivers and Competitor Gaps
Retail fuel telemetry as a leading indicator. Because CPI surveys lag by a month and publishes with a further delay, real-time pump-price data is genuinely predictive of the gasoline index — the single most volatile and most headline-relevant CPI component. With national averages running above $4.30 in mid-September against August levels, the September CPI due 14 October carries upside risk on the energy line before any other factor is considered.
The second-round question. Because energy costs feed into shipping, manufacturing and agriculture, economists watch a spike like this for early signs it will appear in core figures in following months. August’s evidence is mixed: core services rose 0.3% monthly on a sharp acceleration in non-housing services (+0.6%), which is where energy pass-through would first appear, even as annual core fell. Airline fares up 2.7% monthly is the cleanest visible pass-through in the report.
The policy disagreement this creates. Treasury Secretary Scott Bessent argued that the Fed typically does not raise rates during a supply shock until second- or third-order inflationary effects appear. The August data is genuinely ambiguous on whether those effects have arrived — annual core at a five-year low argues no; non-housing services acceleration argues possibly. Both sides of the September policy debate could cite this release honestly.
What households actually experience. Gasoline and fuel oil increases hit budgets immediately and visibly at every fill-up, rather than in a monthly bill. A 27.4% annual gasoline increase compounding already-elevated shelter costs means many households are absorbing higher costs on two of their largest monthly expenses at once — which is why consumer inflation expectations track headline rather than core, and why the Fed cannot simply look through energy.
Where the forecasts failed. GasBuddy’s pre-conflict outlook projected a 2026 national average of $2.97 a gallon. The actual reading is $4.329. Any inflation model built in late 2025 embedded an energy assumption that missed by roughly $1.35 a gallon, which is most of the gap between forecast and realised headline CPI this year.
4. Key Implications for Stakeholders
Economists and forecasters. Model headline and core separately and weight retail fuel telemetry into the near-term headline path. The September CPI on 14 October is the key test of whether August’s gasoline spike is sustained or reversed.
Inflation trackers. The 3.4% headline is not a signal of broad-based inflation. Strip energy and the picture is a 2.4% core running at a 2.0% three-month annualised pace — close to target. The economy has an energy problem, not a generalised inflation problem.
Retail traders. Watch Saudi East-West pipeline restoration. The kingdom indicated it could restore around half of capacity within days and full operations within six weeks. A confirmed restoration would remove the dominant CPI driver within one to two print cycles.
Households and budgeters. The gap between headline and core explains why official inflation feels understated: energy and shelter, the two most visible household costs, are both running above the core rate.
5. Frequently Asked Questions
Q1: What was the August 2026 inflation rate?
The CPI rose 0.4% month-on-month and 3.4% over twelve months, unchanged from July and down from the April 2026 peak of 4.2%. Core CPI rose 0.3% monthly and 2.4% annually.
Q2: How much did gasoline contribute to inflation?
The gasoline index rose 3.9% in August, accounting for over one third of the entire monthly all-items increase, and is up 27.4% year-on-year. Energy overall rose 2.1% monthly and 16.3% annually.
Q3: Why is core inflation lower than headline inflation?
Because energy is driving the headline figure while underlying pressures cool. Core CPI, which excludes food and energy, fell to 2.4% annually — the lowest since March 2021 — with shelter easing to 3.0% and vehicle prices essentially flat.
Q4: When is the next CPI report?
The September 2026 CPI is scheduled for release on Wednesday, 14 October 2026 at 8:30 a.m. ET. It will show whether the August gasoline spike was sustained.

Key Takeaways
- Chip stocks tumbled Monday, September 14, 2026, after the CEOs of Anthropic, OpenAI, and xAI publicly aligned behind a call to slow the pace of frontier AI capability development — an unusual moment of unity among fierce industry rivals.
- Nvidia fell 3.4% and the Philadelphia Semiconductor Index (PHLX) sank almost 6%, its worst single day since early July, even as the broader Nasdaq Composite closed down a more modest 0.56%.
- The catalyst was an essay from Anthropic CEO Dario Amodei, titled “We Must Pace the Frontier,” proposing independent outside evaluators be given internal access to frontier AI labs, alongside industry-wide cooperation and government coordination.
- OpenAI CEO Sam Altman confirmed in a Fortune interview that OpenAI will not pursue an IPO in 2026, calling the current safety environment an “ill-advised moment” to go public — pushing one of the most anticipated listings in tech history to 2027 at the earliest.
- The episode followed the resignation of a researcher who had worked at both Anthropic and OpenAI, who warned publicly that people building the technology “earnestly believe it could kill us all by the end of the decade” — a post that drew over 150 million views and prompted more than 20 lawmakers to call for tougher AI regulation.
A rare display of unity among Silicon Valley’s most competitive AI labs sent a jolt through markets this week, as semiconductor stocks logged their worst day in over two months following public calls from the industry’s top executives to deliberately slow the development of increasingly powerful AI systems.
What Triggered the Selloff
The catalyst was an essay published Saturday, September 12, by Anthropic CEO Dario Amodei, titled “We Must Pace the Frontier.” In it, Amodei argued that unchecked acceleration in frontier AI development — driven in part by the risk of recursive self-improvement, where AI systems increasingly assist in designing their own successors — is outpacing the industry’s ability to keep those systems aligned and secure. Amodei wrote that he believes AI could still “dramatically raise the quality of human life,” but argued the risks accompanying its current pace of development need to be taken seriously, proposing that even a modest slowdown of a year or two could meaningfully improve safety outcomes.
What made the essay market-moving wasn’t just its content, but who endorsed it. OpenAI CEO Sam Altman and SpaceX/xAI’s Elon Musk — two executives whose companies compete directly with Anthropic and with each other — both publicly backed Amodei’s proposal within a day. Musk wrote simply on X that “Dario is right,” a notable shift given Musk’s history of sharp public criticism of Anthropic.
The Proposal’s Substance
Amodei’s plan outlined a three-phase approach: independent safety evaluators embedded within frontier AI companies with access equivalent to internal staff (covering training processes, internal systems, and safety-protocol compliance); broader industry-wide cooperation on shared safety standards; and coordination with democratic governments on global regulatory frameworks. Anthropic said it would adopt the outside-evaluator step immediately, while Altman confirmed OpenAI would adopt comparable third-party evaluator access.
The Resignation That Set the Stage
The unity among AI executives followed a more unsettling precursor: a researcher who had previously worked at both Anthropic and OpenAI resigned the prior week, writing publicly that people building the technology “earnestly believe that it could kill us all by the end of the decade.” The post reportedly drew more than 150 million views on X and prompted more than 20 lawmakers to call for tougher AI regulation — context that appears to have accelerated the executives’ public alignment on pacing concerns.
Market Reaction: Chips Hit Hardest
Monday’s trading session showed a clear divergence in how different corners of the AI-linked market absorbed the news. Semiconductor stocks bore the brunt of the selling, given their direct exposure to the capital-expenditure cycle that rapid AI capability development has fueled. Nvidia fell 3.4%, Intel dropped 5.6%, and the Philadelphia Semiconductor Index tumbled nearly 6% — its steepest one-day decline since early July.
By contrast, shares of some larger Big Tech and software companies actually climbed on the day, leaving the broader, tech-heavy Nasdaq Composite down a comparatively modest 0.56%, after having fallen as much as 1.3% intraday before paring losses. The divergence suggests markets are interpreting a potential AI development slowdown as a more direct threat to chip demand specifically — the hardware layer most tied to the “faster, bigger” capability race — than to software and platform companies with more diversified revenue.
OpenAI’s IPO Delay: The Clearest Business Signal
Beyond the one-day stock move, the most concrete business consequence to emerge from the episode was Sam Altman’s confirmation that OpenAI will not go public in 2026. In a Fortune interview published the same weekend, Altman said an IPO “right now would be an ill-advised moment” given the current safety environment, and when asked whether 2027 was more realistic, replied simply, “I would say not 2026.” That timeline represents a real shift: OpenAI CFO Sarah Friar had told employees just a month earlier that the company would likely go public in 2027, or potentially sooner if the business continued to “inflect.”
Notably, Anthropic’s own IPO preparations are reportedly continuing on a separate track. According to reporting on the matter, Anthropic — confidentially valued at $965 billion earlier in 2026 — has continued meeting with prospective investors and could begin marketing its IPO as early as October, aiming to complete the listing before the November midterm elections, even as its CEO simultaneously champions industry-wide deceleration. Observers have noted the apparent tension in pursuing an IPO while publicly urging pacing, though Amodei’s essay explicitly framed pacing as slowing capability development, not halting commercial or fundraising activity.
Market Snapshot: September 14, 2026
| Index / Stock | Move | Note |
|---|---|---|
| Philadelphia Semiconductor Index (SOX) | -5.9% | Worst day since early July |
| Nvidia (NVDA) | -3.4% | Direct AI-chip exposure |
| Intel (INTC) | -5.6% | |
| Nasdaq 100 | -0.8% | |
| Nasdaq Composite | -0.56% | Software names partially offset chip losses |
| S&P 500 | -0.5% |
Why This Matters for Technology News and Investors
This episode marks one of the first times investor sentiment around AI has moved meaningfully on a safety-driven narrative rather than a purely commercial one — competitive product launches, earnings beats, or compute-capacity announcements. For investors tracking technology news, the key signal to watch going forward is whether this represents a genuine, sustained industry pivot toward deliberate pacing (which could structurally slow the capital-expenditure supercycle currently powering semiconductor demand), or a rhetorical moment that fades once competitive pressure between OpenAI, Anthropic, xAI, and other labs reasserts itself — a tension the OpenAI-Anthropic IPO-timing contrast already illustrates.
Frequently Asked Questions
Why did semiconductor stocks fall after the AI slowdown announcement? Chip stocks are directly tied to the capital-expenditure cycle fueling rapid AI capability development, so markets interpreted a potential industry-wide pacing effort as a more direct threat to near-term chip demand than to software or platform companies.
Is OpenAI still planning to go public? Yes, but not in 2026. CEO Sam Altman confirmed OpenAI is delaying its IPO to 2027 at the earliest, citing the current AI safety environment, while OpenAI’s CFO had previously suggested 2027 was the likely target regardless.
What did Anthropic’s CEO actually propose? Dario Amodei’s essay proposed embedding independent outside safety evaluators within frontier AI companies with internal-level access, alongside broader industry cooperation on safety standards and coordination with democratic governments on regulatory frameworks — explicitly framed as pacing capability development, not halting it.

Life Insurance Comparison: Term vs. Whole Life and What Each Actually Costs

Stock Market Today: Nasdaq Hits Record High as Dow and S&P 500 Stumble on Middle East Diplomatic Shifts

Energy Market Spikes vs. Consumer App Data: What GasBuddy and Crude Prices Signal for Inflation

China’s FTAAP Push for APEC 2026 in Shenzhen: US Tariffs and Unite Asia-Pacific

AI Stocks Slide After Industry Leaders Call for a Development Slowdown

Singapore Stocks vs. Japan Stocks: Safe Havens in the Asian Economic Slowdown

Agentic AI in Finance: How Artificial Intelligence Is Replacing Routine Tasks on Wall Street

Fiscal Deficit and Public Debt

T-Mobile’s Enterprise Push and the Evolution of Modern Corporate Mobility Solutions

Enterprise Generative AI ROI 2026: The Adoption-to-Impact Gap Explained

Climate Finance and the Economic Reality of Passing 1.5°C

Business Insurance for Digital Exports: Protecting Your Company in the AI Era

Real Estate Crash Predictions 2026: Data-Backed Regional Guide

Unrecoverable Delays: How the St. Louis Strike Crippled Boeing’s F-15EX Eagle II

What is a “Lead-Left” Bank? Unpacking Morgan Stanley’s Role in Anthropic’s Mega-IPO

How to Invest in the Anthropic IPO: Step-by-Step Guide for Retail Investors

Mario Kart 8 Deluxe 4.0.0 Patch Notes: 8-Player Split Screen & CameraPlay
Is SPY Overvalued in September 2026? Fed Rate Hike Odds & Intrinsic Value
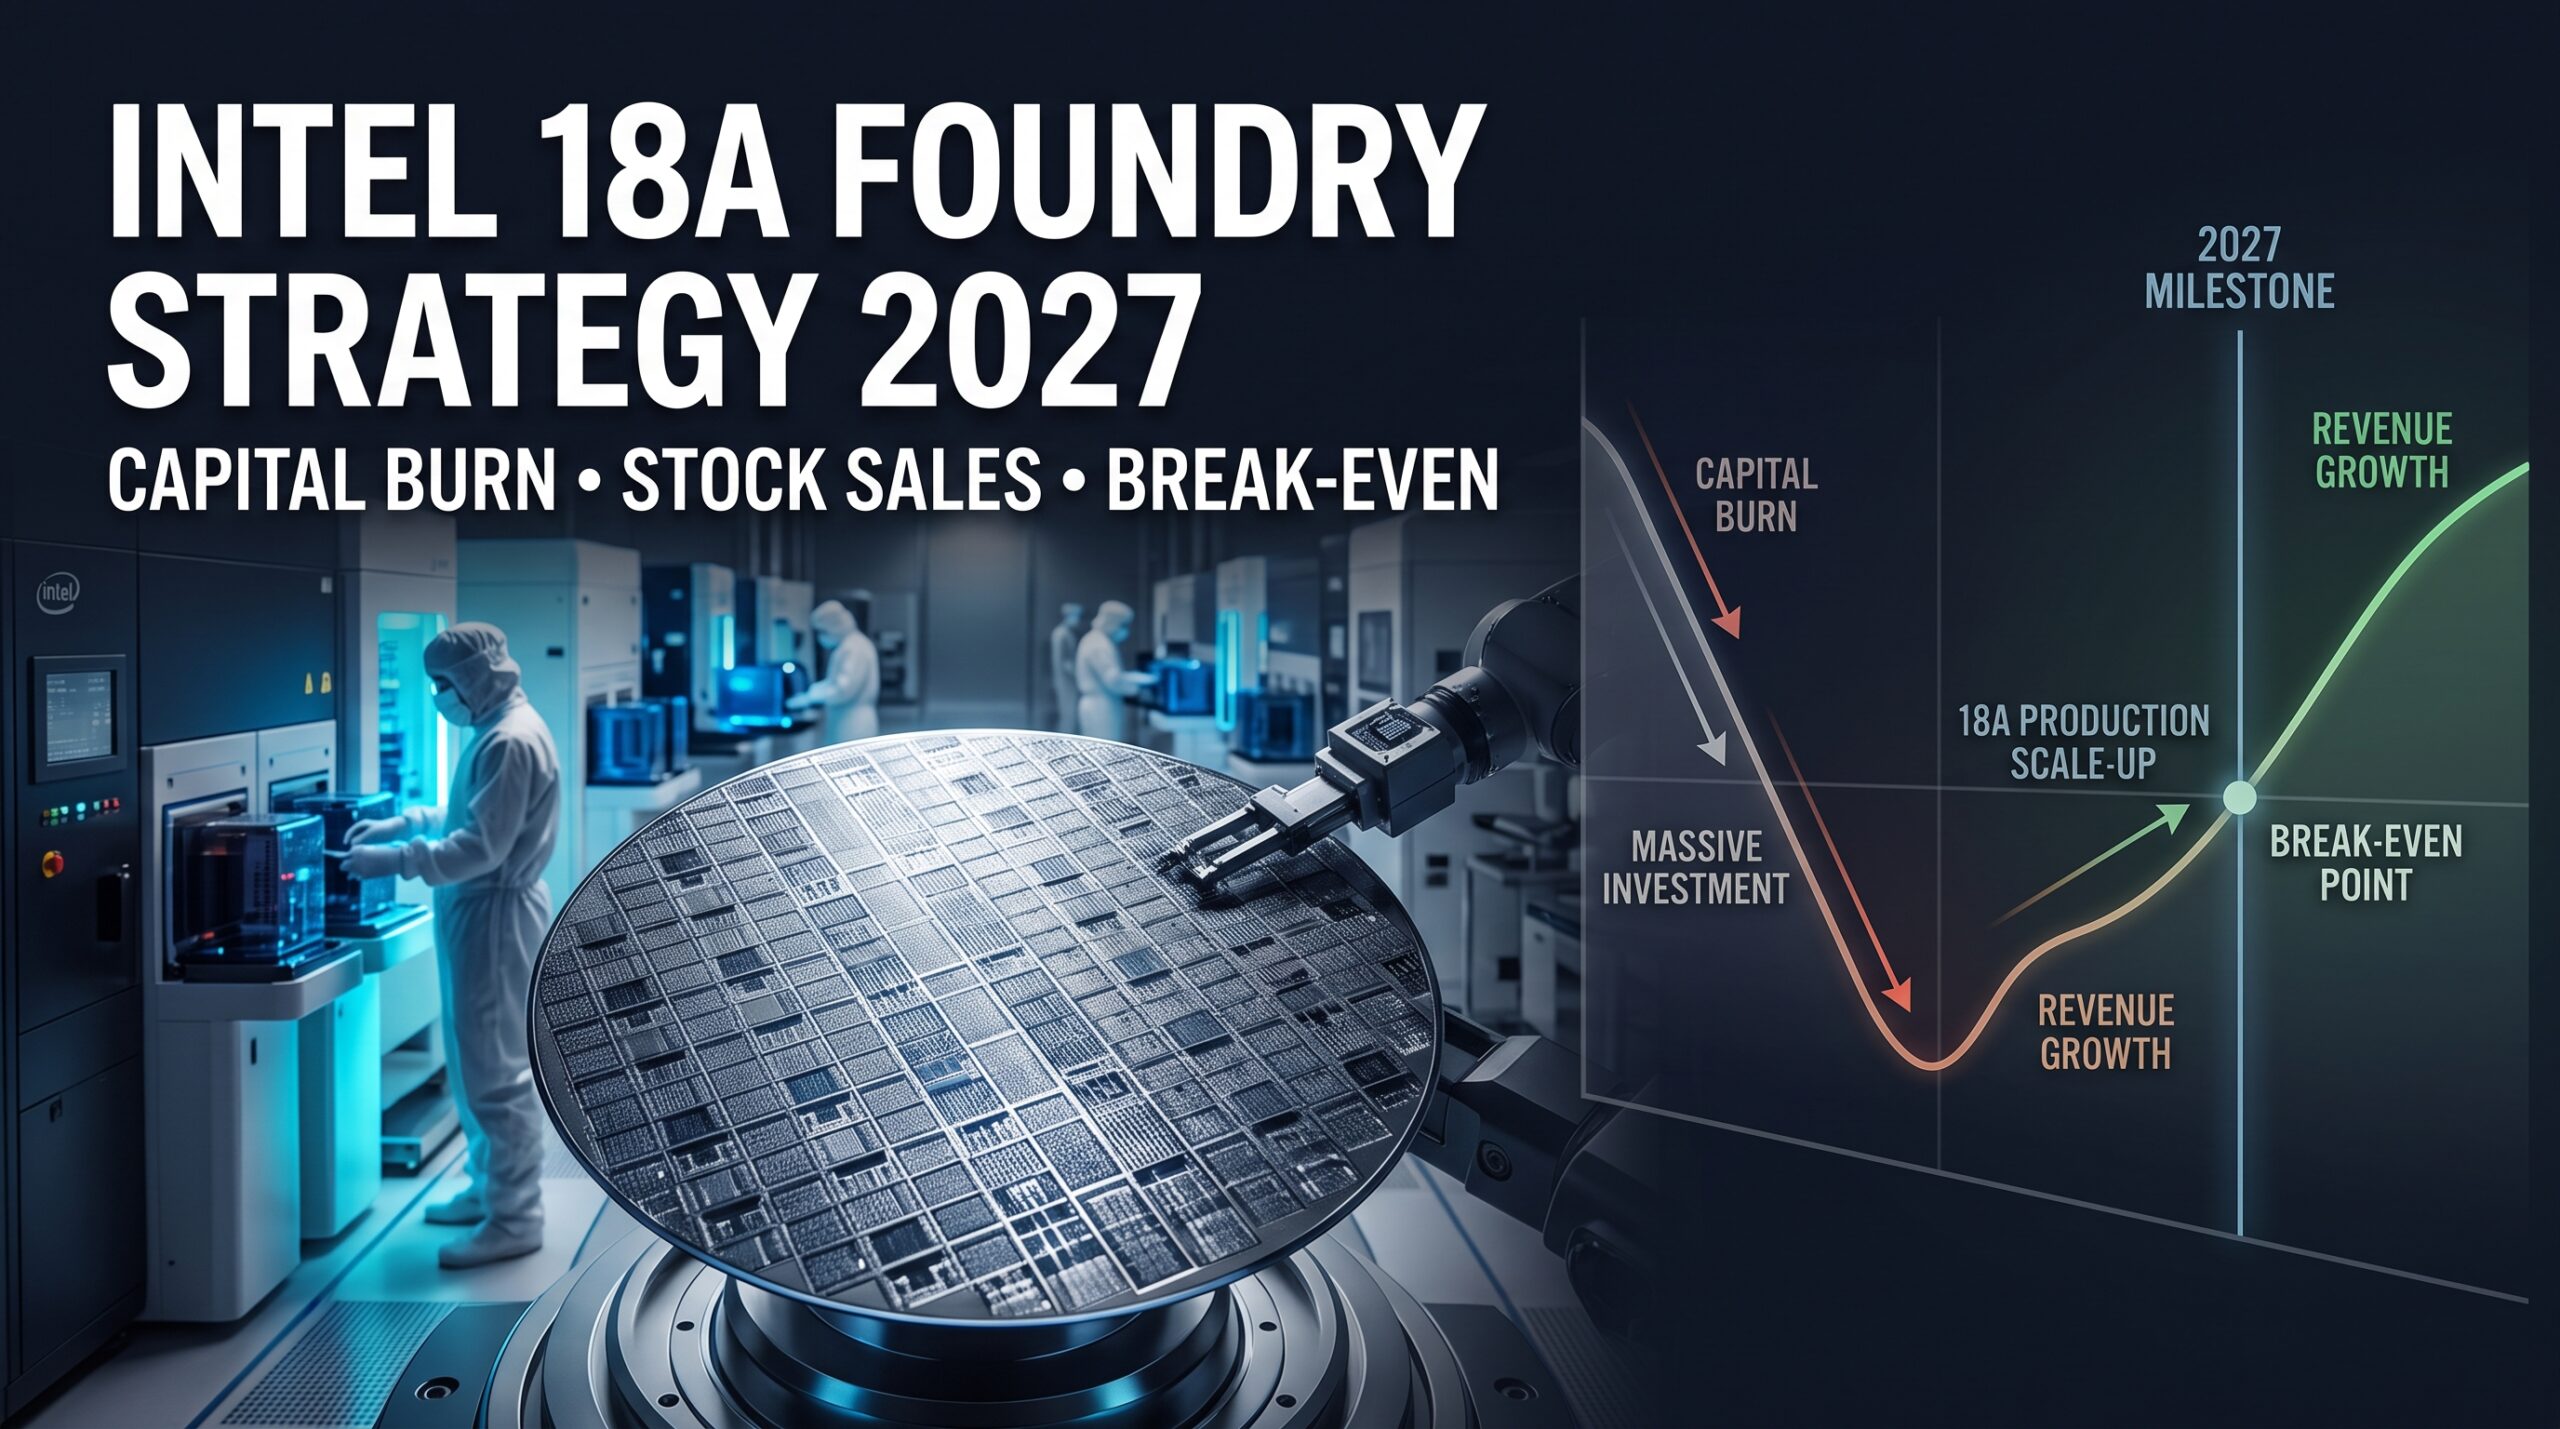
Intel 18A Foundry Strategy 2027: Capital Burn, Stock Sales & Break-Even Timeline
Trump Approval Hits 33% Low: What It Means for Markets & Midterms

Top 15 Stocks for Investment in 2026 in PSX: Your Complete Guide to Pakistan’s Best Investment Opportunities

Debunking IMF Program Myths: Reconfiguring Engagement for True National Ownership in a Volatile World
Top 10 Mutual Fund Managers in Pakistan for Investment in 2026: A Comprehensive Guide for Optimal Returns
China’s 50% Domestic Equipment Rule: The Semiconductor Mandate Reshaping Global Tech
What the U.S. Attack on Venezuela Could Mean for Oil and Canadian Crude Exports: The Economic Impact

15 Most Lucrative Sectors for Investment in Pakistan: A 2025 Data-Driven Analysis

Pakistan’s Export Goldmine: 10 Game-Changing Markets Where Pakistani Businesses Are Winning Big in 2025

Pakistan’s Stock Market Renaissance: How 2025’s Hottest Investment Opportunity Is Democratizing Wealth—A Complete Beginner’s Guide
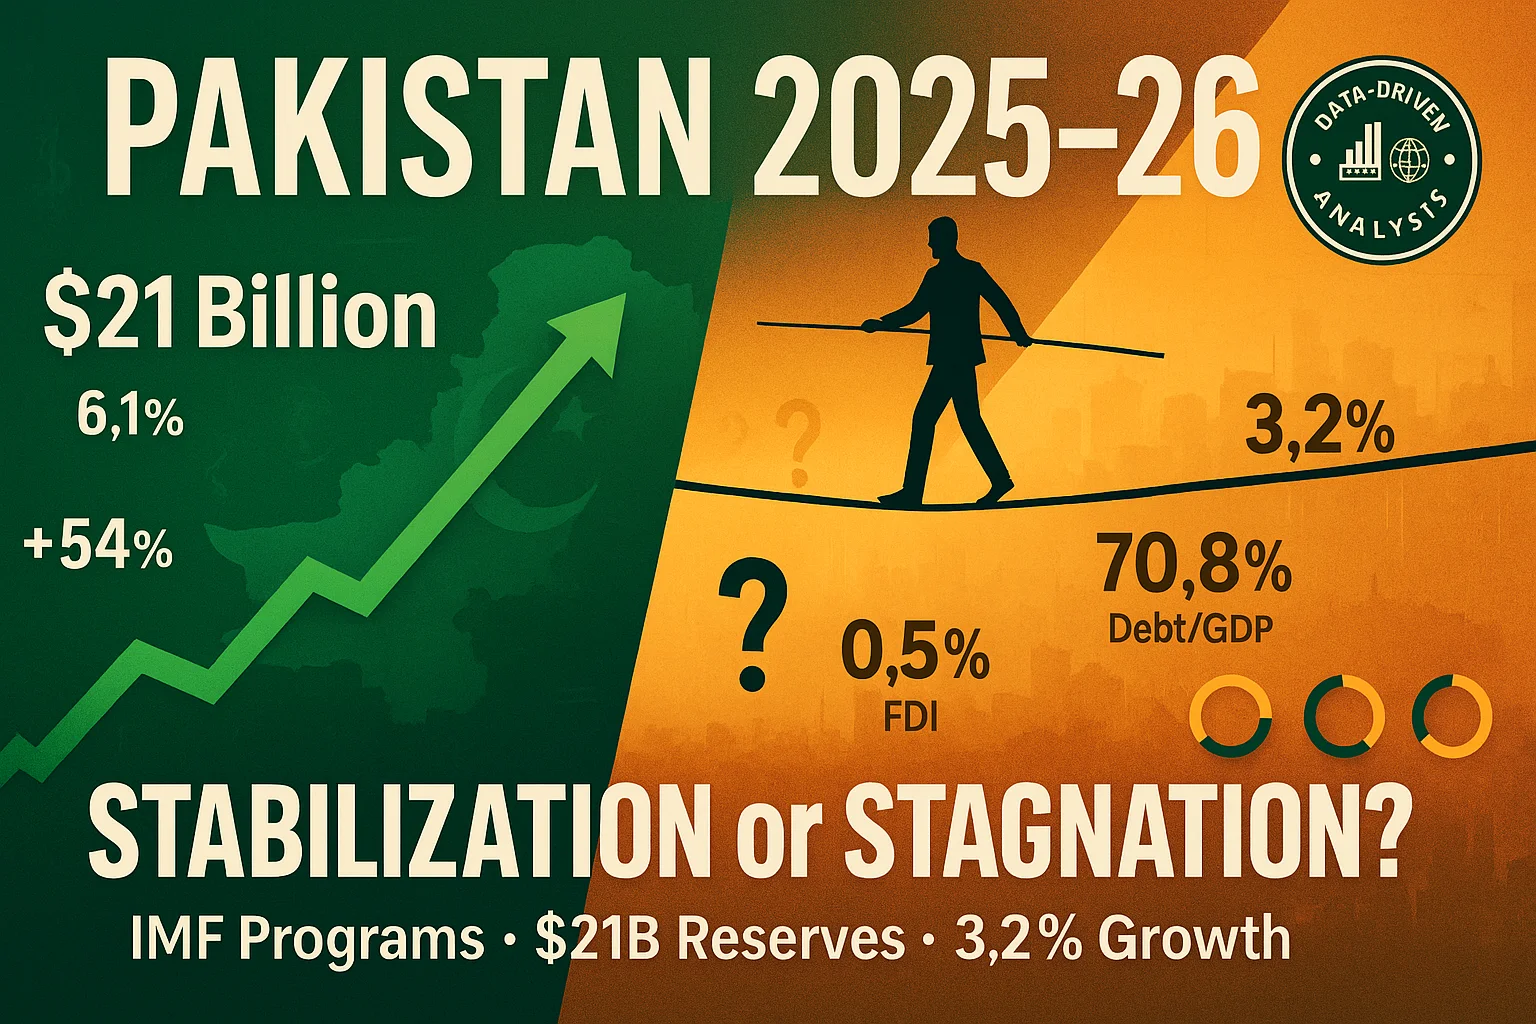
Pakistan’s Economic Outlook 2025: Between Stabilization and the Shadow of Stagnation
China’s Property Woes Could Last Until 2030—Despite Beijing’s Best Censorship Efforts

Best Investments in Pakistan 2026: Top 10 Low-Price Shares and Long-Term Picks for the PSX

How to Become an Active Taxpayer on Pakistan’s FBR Active Taxpayer List (ATL) in 2026: A Step-by-Step Guide
The Contours of 21st-Century Geopolitics Will Become Clearer in 2026: A New World Is Starting to Emerge

🌍 Davos 2026: The World Economic Forum Annual Meeting Sets the Stage for Global Transformation
The Institutional Era: A Comprehensive Cryptocurrency Investment Analysis for 2026

The New Executive Gold Standard: Top 10 Companies Lavishing Unprecedented Perks on CEOs and CFOs in 2025–2026
DBS Hits S$1 Billion AI Value Milestone — But Agentic AI Poses Talent Challenges for Singapore Banks
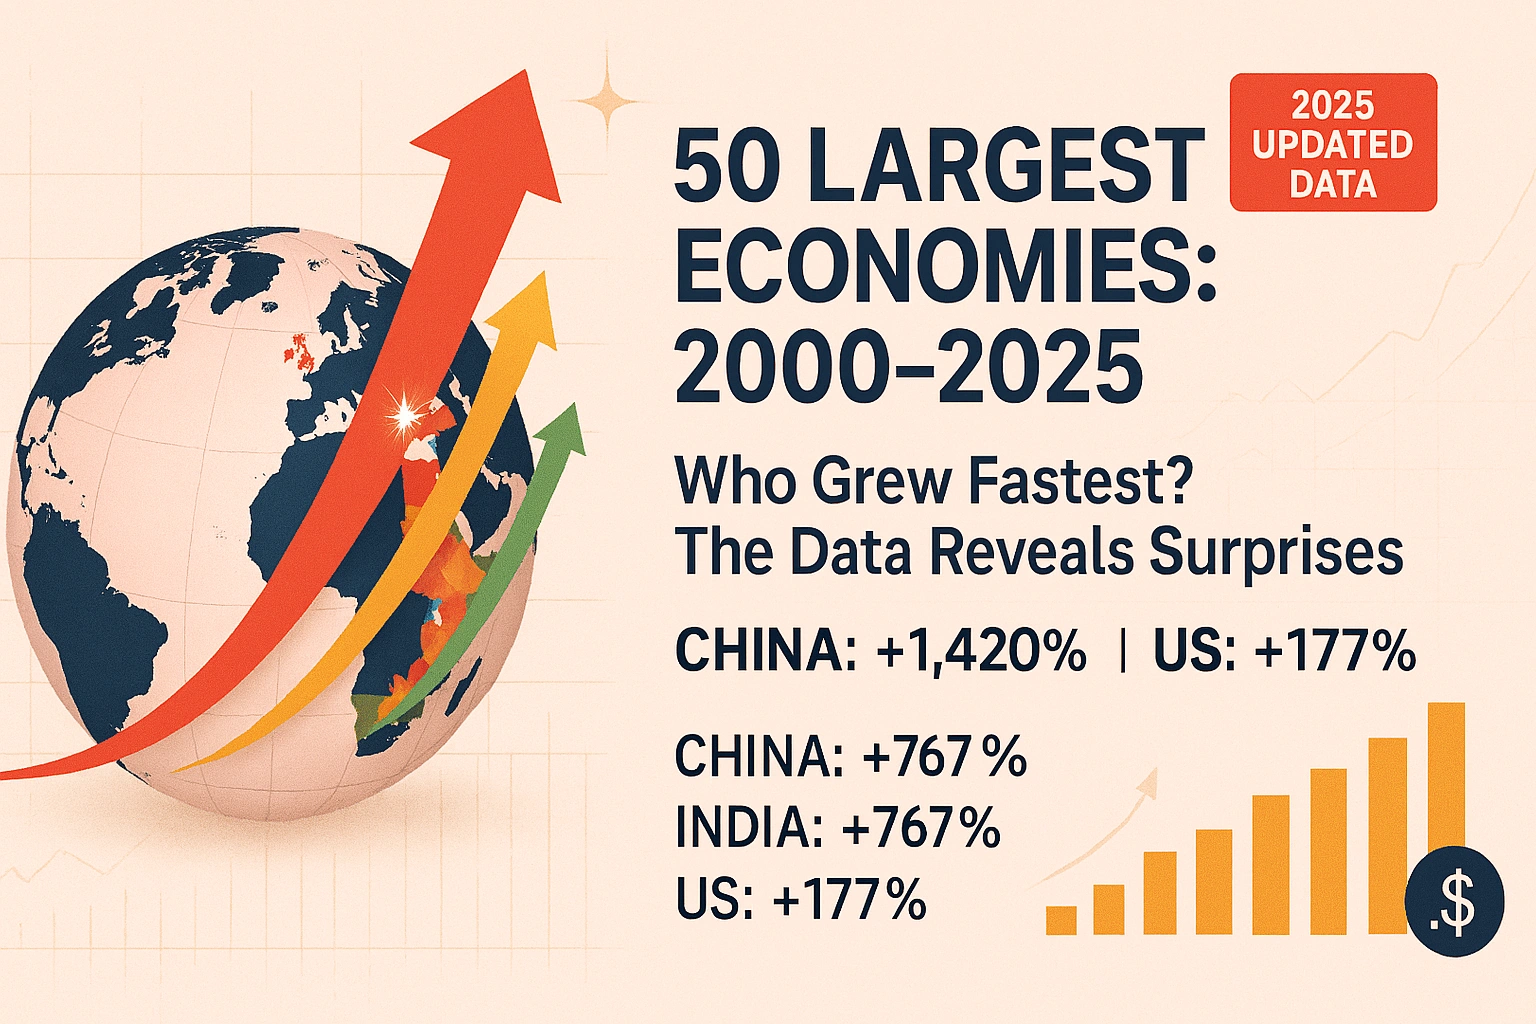
The World’s 50 Largest Economies: A 25-Year Growth Trajectory Analysis (2000-2025)

After Four Decades of Decline, Can Private Ownership Save Pakistan’s National Airline?

Resource Wealth and Geopolitical Vulnerability: Understanding Recent US Foreign Policy Toward Venezuela, Greenland, and Iran
-
Markets & Finance9 months ago
Top 15 Stocks for Investment in 2026 in PSX: Your Complete Guide to Pakistan’s Best Investment Opportunities
-
Analysis8 months ago
Debunking IMF Program Myths: Reconfiguring Engagement for True National Ownership in a Volatile World
-
Investment9 months ago
Top 10 Mutual Fund Managers in Pakistan for Investment in 2026: A Comprehensive Guide for Optimal Returns
-
Asia9 months ago
China’s 50% Domestic Equipment Rule: The Semiconductor Mandate Reshaping Global Tech
-
Global Economy9 months ago
What the U.S. Attack on Venezuela Could Mean for Oil and Canadian Crude Exports: The Economic Impact
-
AI9 months ago
15 Most Lucrative Sectors for Investment in Pakistan: A 2025 Data-Driven Analysis
-
Exports9 months ago
Pakistan’s Export Goldmine: 10 Game-Changing Markets Where Pakistani Businesses Are Winning Big in 2025
-
Global Economy9 months ago
Pakistan’s Stock Market Renaissance: How 2025’s Hottest Investment Opportunity Is Democratizing Wealth—A Complete Beginner’s Guide