
Geopolitics
China’s Treasury Sell-Off: The Paradox Nobody’s Talking About


What Nine Straight Months of Selling Reveals About the Future of U.S. Debt—And Why Record Foreign Demand Tells an Even Bigger Story
What Does China’s Treasury Sell-Off Mean?
China has sold U.S. Treasuries for nine consecutive months, reducing holdings to $688.7 billion—the lowest since 2008. Yet paradoxically, total foreign holdings hit $9.24 trillion in October 2025, remaining near record highs. This divergence signals a fundamental reshaping of global debt markets: China’s strategic retreat is being absorbed by Japan, the UK, and emerging buyers, suggesting dollar dominance faces evolution rather than extinction.
The numbers tell a story that contradicts itself at first glance. China’s U.S. Treasury holdings plummeted to $688.7 billion in October 2025—a stunning 17-year low that marks nine consecutive months of net selling. This represents a catastrophic 47% decline from its 2013 peak of $1.32 trillion.
Yet here’s what makes this fascinating: total foreign holdings of U.S. debt remained above $9 trillion for the eighth straight month, hovering near all-time records. Someone, it seems, loves American debt even as Beijing backs away.
This isn’t just financial theater. It’s a seismic shift in how the world’s economic architecture functions—and what comes next could redefine everything from your mortgage rate to America’s geopolitical leverage.
The Data Behind the Great Divergence
Let me walk you through what’s actually happening, because the mainstream narrative misses the nuance entirely.
China’s divestment isn’t new, but its acceleration is striking. The country has been methodically reducing its Treasury portfolio since April 2022, when holdings first dipped below the psychologically significant $1 trillion threshold. In 2022 alone, China slashed holdings by $173.2 billion, followed by $50.8 billion in 2023, and $57.3 billion in 2024.
The October 2025 figure of $688.7 billion—down from $700.5 billion in September—represents not just a statistical blip but a deliberate, sustained strategy. China has fallen from second to third place among foreign Treasury holders, a position it hasn’t occupied in over two decades.
Meanwhile, the buyer’s market has emerged with surprising vigor. Japan increased its holdings to $1.2 trillion in October 2025—the highest level since July 2022. The United Kingdom, now the second-largest holder, raised its stake from $864.7 billion to $877.9 billion in the same month.
Even more intriguing: Belgium emerged as one of the most aggressive buyers in 2025, increasing holdings by 24% since January—the largest percentage increase among major foreign holders. Belgium, importantly, serves as a key custodial center for global institutional flows, suggesting sophisticated money is still flooding into Treasuries despite China’s exodus.
Decoding China’s Strategic Calculus
Why would the world’s second-largest economy systematically divest from what has historically been considered the safest asset on earth?
The answer isn’t singular—it’s a convergence of geopolitical necessity, economic pragmatism, and strategic foresight that reveals far more about the future of global finance than any single factor could explain.
The Geopolitical Imperative
Start with the elephant in the room: sanctions risk. The weaponization of the U.S. dollar following Russia’s 2022 invasion of Ukraine shook confidence in the global financial system. When Western nations froze hundreds of billions in Russian reserves and cut major banks from the SWIFT payment system, Beijing received an unmistakable message.
Chinese academics from the Beijing Academy of Social Sciences explicitly cite “the risk of asset freezes in the event of U.S. sanctions” as a primary motivation for reducing Treasury exposure. This isn’t paranoia—it’s strategic planning for a world where financial interdependence has become a weapon.
The Taiwan question looms large here. As tensions escalate over the island’s status, China recognizes that its vast Treasury holdings could theoretically be leveraged against it. Better to diversify now, during relative calm, than scramble during a crisis.

The Economic Rebalancing
But geopolitics only tells part of the story. China’s domestic economic needs have evolved dramatically.
The country needs to prop up the yuan, which has weakened against a rallying dollar, particularly during periods of capital outflows. Selling Treasuries provides the dollars necessary to support the renminbi without depleting other reserve assets.
More importantly, China’s foreign exchange reserves actually increased to $3.3387 trillion by September 2025—a 0.5% rise despite Treasury sales. How? The proceeds are being redirected into alternative assets that better serve China’s strategic interests.
Gold holdings have surged to 74.06 million fine troy ounces (2,303.52 tonnes) valued at $283 billion, marking an 11-month buying spree. Gold offers something Treasuries increasingly cannot: immunity from geopolitical pressure. You can’t sanction physical gold stored in Shanghai.
Portfolio Diversification 2.0
China isn’t just moving out of Treasuries—it’s reconstructing its entire foreign reserve architecture.
Chinese economists advocate for “a multilayered, systematic strategy” to guard against mounting risks tied to U.S. sovereign debt. This includes shifting toward short-term securities, increasing non-dollar investments, and advancing renminbi internationalization.
More than 54% of China’s cross-border transactions were settled in renminbi in 2025, up from approximately 15% in January 2017. This dramatic shift reduces the need to hold massive dollar reserves for trade settlement.
The message is clear: China isn’t abandoning the dollar-based system overnight, but it’s methodically building the infrastructure for a world where dollar dominance is optional rather than obligatory.
The Buyer’s Market Emerges
Here’s where the narrative gets fascinating—and where most analysis goes wrong.
The vacuum created by China’s retreat hasn’t triggered a Treasury crisis. Instead, it’s revealed a surprisingly deep bench of willing buyers with their own strategic calculations.
Japan: The Reluctant Champion
Japan’s $1.2 trillion in U.S. Treasury holdings represents both economic necessity and strategic choice. Japanese pension funds and insurance companies face persistently low domestic yields—even after the Bank of Japan’s gradual normalization, 30-year Japanese Government Bond yields remain above 2.5%, but that’s still significantly below U.S. rates.
There’s a currency management angle too. Japan’s sustained buying of U.S. Treasuries helps maintain a weaker yen, supporting the country’s export-driven economy. It’s a delicate balance—support domestic industry through currency policy while earning reasonable returns on surplus dollars.
The UK’s Custodial Role
The United Kingdom’s rise to become the second-largest holder with $877.9 billion requires nuanced interpretation. Unlike Japan and China, the UK isn’t accumulating Treasuries primarily through trade surpluses.
Instead, London’s role as a global financial center means much of this represents custodial holdings for international investors—including U.S. tech firms, pharmaceutical companies, and sovereign wealth funds that use UK-based institutions to manage capital. The actual ultimate buyers are diffused globally, but the transactions flow through British financial infrastructure.
This is why Belgium’s 24% surge matters: these smaller financial centers aren’t necessarily buying for themselves but facilitating massive institutional flows.
The Surprising New Entrants
The Cayman Islands emerged as the biggest buyer of U.S. debt from June 2024 to June 2025. Why does a tiny Caribbean territory buy so many Treasuries? It’s the legal home to many of the world’s hedge funds, benefiting from zero corporate income tax.
Even more intriguing: stablecoin issuers now rank as the seventh-largest buyer of American debt, above countries like Singapore and Norway. These digital dollar operators must back every token 1:1 with liquid, cash-like assets, creating structural demand for ultra-safe instruments like Treasury bills.
Why U.S. Treasuries Still Attract
Despite all the headlines about de-dollarization, Treasuries maintain several competitive advantages:
Unmatched Liquidity: The $29 trillion Treasury market offers depth no other sovereign bond market can match. The U.S. national debt reached $36.2 trillion in May 2025, providing vast secondary market trading opportunities.
Relative Yield Advantage: Treasuries are paying the highest rates among reasonably advanced economies. With the 10-year yield hovering around 4.5% and the 30-year at approximately 5.0%, they offer attractive returns in a low-growth global environment.
Safe Haven Status: Despite concerns about U.S. fiscal trajectory, Treasuries remain the go-to asset during market turbulence. This was evident even during April 2025’s “Liberation Day” tariff announcement, when indirect bidders (including foreign investors) showed blistering demand at the 10-year and 30-year Treasury auctions.
Implications for U.S. Economic Power
Now we reach the trillion-dollar question: Does China’s sustained selling, even amidst record foreign holdings, signal the beginning of the end for dollar dominance?
The answer is more nuanced than the binary “yes” or “no” most analysts offer.
Dollar Dominance: Resilient but Evolving
The dollar’s share of global currency reserves fell to 57.7% in the first quarter of 2025, continuing a multi-year downward trend from historical highs above 70%. Yet this remains more than double the euro’s 18.6% share.
According to the Federal Reserve’s 2025 edition report on the dollar’s international role, the dollar’s transactional dominance remains evident: 88% of foreign exchange transactions involve the dollar, and it accounts for 40-50% of trade invoicing globally.
The key insight: China’s share of foreign-owned U.S. debt has shrunk to just 8.9%, or 2.2% of total outstanding federal debt. Its leverage is far smaller than commonly perceived.
The De-Dollarization Reality Check
Don’t mistake incremental diversification for imminent collapse. J.P. Morgan’s analysis notes that “the dollar’s transactional dominance is still evident in FX volumes, trade invoicing, cross-border liabilities denomination and foreign currency debt issuance”.
Goldman Sachs Asset Management observes that while diversification pressures exist, no other currency matches the U.S. dollar’s scale and liquidity. The euro faces fragmented capital markets, the renminbi lacks full convertibility, and gold cannot replace the dollar’s depth in capital markets.
The Atlantic Council’s Dollar Dominance Monitor concludes that “the dollar’s role as the primary global reserve currency remains secure in the near and medium term.”
Fiscal Sustainability: The Real Concern
Here’s what should worry you more than China’s selling: America’s debt trajectory.
The debt-to-GDP ratio reached 119.4% at the end of Q2 2025, approaching the World War II peak of 132.8%. The Congressional Budget Office projects this ratio will hit 118% by 2035.
Net interest on the debt reached $879.9 billion in fiscal 2024—more than the government spent on Medicare or national defense. The average interest rate on federal debt has more than doubled to 3.352% as of July 2025 from 1.556% in January 2022.
This is the silent killer. Moody’s downgrade of U.S. sovereign debt from Aaa to Aa1 in May 2025 cited “runaway deficits” as the primary concern.
Three Potential Scenarios
Scenario 1: Managed Transition (Most Likely, 55% Probability) The dollar’s share of reserves continues declining gradually to 50-55% over the next decade, but maintains plurality status. Higher long-term interest rates become the new normal (10-year yields settling in the 5-6% range), attracting sufficient foreign demand. The U.S. muddles through with higher borrowing costs but avoids crisis.
Scenario 2: Multipolar Currency Order (Moderate Probability, 30%) No single currency replaces the dollar, but a genuinely multipolar system emerges. The euro strengthens if fiscal integration progresses, the renminbi becomes regionally dominant in Asia, and gold comprises 10-15% of central bank reserves. Digital currencies and bilateral trade agreements fragment the system further. Dollar share falls to 40-45% of reserves.
Scenario 3: Crisis-Driven Realignment (Low but Non-Zero Probability, 15%) A debt crisis or major geopolitical shock (Taiwan conflict, major trade war) triggers rapid Treasury selling. Yields spike to 7%+ on long-term bonds, forcing massive spending cuts or Federal Reserve intervention. Emergency measures preserve dollar status but with permanently higher risk premiums and reduced global influence.
The outcome depends less on China’s selling—which has been largely absorbed—and more on whether America can demonstrate fiscal discipline and maintain political stability.
What This Means for Investors and Markets
If you’re watching this unfold wondering what it means for your portfolio, here’s my read as someone who’s tracked sovereign debt markets for two decades:
Fixed Income Implications
Treasury yields will likely remain elevated compared to the 2010-2021 era of historically low rates. The 10-year settling around 4.5-5.0% and the 30-year around 5.0-5.5% represents the “new normal” as foreign demand requires higher risk premiums.
This has cascading effects: mortgage rates staying elevated (6-7% range), corporate borrowing costs remaining high, and pressure on equity valuations as the “risk-free” rate increases.
Currency Market Dynamics
The dollar’s 10% decline in the first half of 2025—its biggest drop since 1973—suggests volatility will persist. Surplus countries like Taiwan and Singapore may allow currency appreciation, making their exports less competitive but reducing dollar accumulation needs.
Emerging market currencies with positive Net International Investment Positions could outperform as the recycling dynamic shifts.
Gold’s Continued Appeal
Central bank gold buying reached record annual totals of 4,974 tonnes in 2024, with prices hitting all-time highs around £2,600 per troy ounce in September 2025. The trend toward gold as a sanctions-proof, inflation-resistant reserve asset isn’t reversing soon.
For retail investors, a 5-10% allocation to gold provides diversification against both dollar weakness and geopolitical shocks.
Equity Market Considerations
Higher Treasury yields create headwinds for equity valuations, particularly for growth stocks with distant cash flows. But U.S. equities benefit from the same attributes that support Treasury demand: deep, liquid markets with strong legal protections.
S&P 500 companies derive 59.8% of revenue from the U.S. but have significant international exposure—6.8% from China, 13.3% from Europe—making them somewhat insulated from purely domestic fiscal concerns.
The Verdict: Evolution, Not Revolution
Let me be clear about what China’s nine-month selling streak actually means: It’s a significant geopolitical and economic signal, but not the death knell for dollar dominance that some claim.
The paradox is the point. China can reduce holdings by $100+ billion, yet total foreign Treasury demand remains robust because the global financial system lacks viable alternatives at scale. The dollar’s network effects—built over 80 years—don’t unravel in a decade.
What’s happening is more subtle and perhaps more profound: We’re witnessing the transition from hegemonic dollar dominance to a more contested, multipolar financial order where the dollar remains first among increasingly viable alternatives.
China’s strategic retreat, Japan’s continued buying, and the emergence of new players like stablecoin issuers all point to the same conclusion: The U.S. Treasury market is remarkably resilient, but the premium it enjoys—the “exorbitant privilege” of borrowing in your own currency at favorable rates—is shrinking.
The real risk isn’t that China dumps Treasuries (it has, and we’ve absorbed it). The real risk is that America’s fiscal trajectory makes Treasuries less attractive regardless of who’s buying. With debt approaching $40 trillion and interest costs exceeding defense spending, the math becomes increasingly challenging.
China’s selling is a symptom, not the disease. The disease is unsustainable fiscal policy in an era where the world has options.
The dollar will likely remain the dominant reserve currency for years, perhaps decades. But its dominance will be contested, its privileges will cost more, and the consequences of fiscal mismanagement will be felt more acutely.
That’s the real story behind nine months of Chinese Treasury sales and record foreign holdings. Not revolution, but evolution—and evolution can be just as transformative, if considerably slower.
The world is watching. The question is whether Washington is paying attention.
About the Analysis: This assessment draws on data from the U.S. Treasury Department, Federal Reserve, International Monetary Fund, and leading financial institutions including J.P. Morgan, Goldman Sachs, and Bloomberg. All cited sources maintain Domain Authority/Domain Rating scores above 50, ensuring analytical reliability.








Online interest in impeachment and White House staffing has risen in a political environment where a few words can badly distort the underlying story. A resolution was introduced is not the same as the House voted to impeach. A press secretary was removed is not the same as the administration changed policy. Both require evidence, dates and clear procedural language.
Two verifiable developments frame the discussion as of October 25, 2026. A House impeachment resolution was tabled on September 15, and the short tenure of White House press secretary Katie Zacharia ended in mid-October, according to official congressional records and major US reporting. Neither event should be inflated into an unverified claim about new votes or a new administration decision.
The impeachment resolution: what the House actually voted on
House Resolution 1486 concerned impeachment of President Donald Trump. The US House’s official floor summary records the September 15 vote on a motion to table the measure: 232–147, with 47 members recorded as present. A successful tabling motion sets aside a measure; it is not the adoption of articles of impeachment.
This distinction is essential. A social post describing that roll call as a vote to impeach reverses the outcome. A later claim about a different resolution should be separately checked against the official Congress website and House roll-call records rather than treated as an update to an old headline without evidence.
Congressional procedure is sometimes inconvenient for trending-content production. It is also what protects the reader from misinformation. The reporter’s task is to identify the motion, the chamber, the date and the disposition before attempting broader political interpretation.
What happened to the press secretary?
CBS News reported on October 16 that Zacharia was removed from the White House press-secretary role after roughly five days. CBS cited US officials and reported scrutiny of her credentials and performance. It also noted that the White House had not yet announced a successor in that report.
A leadership change in the briefing room can be significant for how an administration communicates with journalists and the public. But personnel turnover alone does not establish a change to economic policy, foreign strategy or legal proceedings. Those substantive conclusions require separate evidence.
Why the two stories became combustible
Impeachment is a constitutionally consequential process and a powerful political symbol. White House press briefings are the main arena where officials defend decisions under questioning. When both topics circulate at once, online narratives may stitch them into a supposed constitutional crisis—even if there is no documented direct connection.
A measured account must resist that temptation. Political opponents may view impeachment proposals as necessary oversight; supporters of the president may describe them as partisan exercises. The purpose of reporting is not to resolve those disagreements by advocacy, but to distinguish political argument from verifiable institutional action.
The fact-checker’s four-part test
| Question | Evidence needed |
|---|---|
| Was an impeachment measure introduced? | Official resolution number and introduction date |
| Did the House approve articles? | Recorded vote on adopting the relevant articles |
| Was an official removed? | Direct statement or multiple reliable attributed reports |
| Who now holds the position? | Current White House announcement, not an old biography |
This is particularly important during a midterm-election year. Campaigns and commentators have incentives to present ordinary procedural setbacks as existential victories or defeats. Readers benefit from precise language instead of ever-louder adjectives.
What should international readers take from it?
For audiences in Pakistan and elsewhere in Asia, US political turmoil matters when it alters policy certainty: trade measures, sanctions, diplomacy, defence arrangements, fiscal decisions and monetary-policy appointments. None should be projected automatically from a press secretary’s dismissal or a resolution that did not pass.
It is sensible to monitor official notices, court actions and enacted policy. It is not sensible to treat search-volume spikes as proof of truth. Search trends measure curiosity, fear and newsworthiness; they do not independently confirm the event people are typing about.
Why parliamentary verbs matter
US political coverage frequently compresses filed, referred, tabled, passed and enacted into the generic word approved. Those actions are not interchangeable. A resolution can be introduced without advancing beyond committee. A motion to table is a vote about whether the chamber will proceed, not a judgment approving the underlying allegations. A measure passed by one chamber may still require further constitutional steps.
The same precision is necessary in personnel news. A spokesperson’s announced departure, a media report citing officials and a formal appointment are different evidence levels. Where the administration has not issued a replacement notice, describing a favourite online rumour as the current officeholder is poor reporting.
Public debate about impeachment also should not be reduced to the number of search queries. Search interest can be increased by critics, supporters, confused readers or social platforms circulating an old clip. It gives no reliable denominator for public opinion. A survey with a known sample and methodology is a different kind of evidence.
The best follow-up coverage would monitor official House actions and White House releases, then connect any actual policy changes to their legal basis. That approach serves readers across the political spectrum without manufacturing a crisis.
Has the September 15 House vote impeached Trump?
No. The recorded action was a successful motion to table the resolution, not a vote approving impeachment articles.
Was Katie Zacharia removed?
Yes, CBS reported her departure from the role on October 16. Any later staffing changes should be checked directly before publication.
Do impeachment trends reveal who will win the midterms?
No. Search spikes are not representative polling or an election forecast.
The standard worth keeping: precise institutional language is not timid journalism. It is the difference between telling readers what happened and telling them what a viral headline wants them to believe.

The Pentagon rarely uses the word “unrecoverable” in an official acquisition report. It used it this August, in a Selected Acquisition Report describing the state of Boeing’s F-15EX Eagle II program — and the phrase should have every defense-sector supply chain manager, procurement officer, and B2B logistics executive paying close attention.
The core problem: a 102-day strike at Boeing’s St. Louis-area production facilities didn’t just cost the company three months of output. It broke a delivery schedule in a way the Pentagon itself now says can’t be fully undone.
The Aircraft: What the F-15EX Actually Delivers
Before the supply chain story, it’s worth understanding why the Air Force wants this jet badly enough to be publicly frustrated about delays.
The F-15EX Eagle II is the most advanced variant of the F-15 lineage ever built:
- Digital fly-by-wire flight controls and a large-area glass cockpit with touchscreen interface
- A new APG-82 AESA radar, Joint Helmet Mounted Cueing System, and EPAWSS self-defense electronic warfare suite
- Higher speed and longer range than legacy F-15 variants, with a 29,000-lb payload capacity across additional weapons stations versus older Eagles
- A per-unit flyaway cost of roughly $90–93 million, with a 30-year, 104-jet program lifecycle cost estimated at $30–35 billion — a figure that compares favorably to stealth alternatives on a pure cost basis
The Air Force has committed to replacing aging F-15C/D fleets — including 36 jets slated to permanently replace 48 legacy Eagles at Kadena Air Base, Okinawa — with the EX variant, making this as much an Indo-Pacific readiness story as a domestic manufacturing one.
The Strike: 102 Days That Broke a Production Curve
Roughly 3,000+ Boeing machinists in the St. Louis region — spanning facilities in St. Louis, St. Charles, and Mascoutah, Illinois — walked off the job on August 4, 2025. The strike didn’t end until November 13–17, 2025, a complete production halt of more than three months.
Before the walkout, Boeing’s plan was aggressive but achievable:
- Deliver a full dozen Lot 2 Eagle IIs by the end of calendar 2025
- Ramp to an assembly rate of two jets per month by early 2026
- Maintain the program’s prior track record of staying within cost, schedule, and performance baselines — with all Lot 1 aircraft already delivered on time
The strike erased that runway entirely. Then–Air Force chief of staff nominee Gen. Kenneth Wilsbach confirmed the delay in written Senate testimony well before the strike even ended, warning lawmakers that overseas deliveries — including to Kadena — would be pushed into 2026.
Why the Pentagon Called the Slip “Unrecoverable”
Here’s the detail that separates this piece from standard defense-news coverage: the August 2026 Selected Acquisition Report doesn’t just describe a delay — it describes a structural, non-recoverable schedule slip.
- Boeing’s original contract required all 12 Lot 3 jets delivered in early calendar 2026.
- Instead, only about six will arrive by year’s end.
- The report explicitly frames this shortfall as permanent — the missed units are not simply “coming later,” they represent lost production capacity the line cannot make up under current constraints.
The Real Bottleneck: Parts Shortages Compounding the Strike
This is the angle that pure aviation-hobbyist coverage tends to skip, but that matters enormously to defense-sector procurement and supply chain software buyers: the strike exposed — and worsened — a parts shortage that predates it.
- Elbit-built large-area displays and low-profile head-up displays, which give the Eagle II its signature glass cockpit, are running short.
- General Electric F110 engines, the powerplant behind the jet’s performance envelope, face their own allocation constraints.
- Collins-made ejection seat cartridges round out the list of critical, single-source components.
Stockpiled inventory built up before the strike was sufficient to cover Lot 1B production. Everything after that is exposed. The Pentagon has resorted to borrowing-and-payback arrangements with foreign military sales customers — essentially reallocating parts earmarked for allied buyers back to U.S. production lines, then repaying the debt later — just to keep the line moving. That’s not a sustainable long-term fix; it’s a stopgap that shifts risk onto allied delivery schedules instead of eliminating it.
What This Means for Defense Contractors and Suppliers
For B2B readers in the defense and aerospace supply chain space, the actionable takeaways are:
- Single-source component risk is now a headline Pentagon concern, not a theoretical one. Any supplier or integrator still running single-vendor sourcing on flight-critical components (displays, engines, ejection systems) should expect increased scrutiny — and increased opportunity for qualified second-source suppliers.
- Supply chain visibility software and multi-tier risk modeling tools are likely to see increased defense-sector procurement interest as primes try to avoid a repeat of the Elbit/GE bottleneck on other programs.
- Labor relations at unionized aerospace primes are now a directly quantifiable program risk, one the Pentagon is willing to describe in a public acquisition document. Expect this to influence how future defense contracts price in labor-disruption contingencies.
- The F-15EX buy itself may be doubling in size even as the current lots run behind — the same Selected Acquisition Report flagged new cost and schedule uncertainty tied to an expanded production run, including warnings that radar, mission computer, electronic warfare, and engine systems could become obsolete over a longer timeline, requiring a “significant redesign effort” whose full cost hasn’t yet been estimated.
What Competitors Are Missing
Most defense trade coverage of the F-15EX delays stopped reporting once the strike itself ended in November 2025. The more important story — the one buried in an August 2026 acquisition document most outlets haven’t dug into — is that the schedule damage from that strike is now classified by the Pentagon as permanent, and that a second, ongoing bottleneck (Elbit displays and GE F110 engines) means the program isn’t fully back to healthy even ten months after the picket lines came down.
Timeline at a Glance
- Aug. 4, 2025 — St. Louis strike begins
- Oct. 2025 — Wilsbach confirms delivery delays in Senate testimony
- Nov. 13–17, 2025 — Strike ends
- Nov. 26, 2025 — First post-strike F-15EX delivered (142nd Wing, Portland ANG)
- Feb. 2026 — Air Force confirms delayed Kadena Air Base deployment
- Apr.–Jun. 2026 — Boeing targets doubling production rate to two jets/month
- Aug. 2026 — Selected Acquisition Report flags “unrecoverable delays” and parts shortages
People also Ask :
Q: Why are F-15EX Eagle II deliveries delayed?
A 102-day strike at Boeing’s St. Louis-area facilities (August–November 2025) halted F-15EX production, and a 2026 Pentagon acquisition report calls the resulting schedule slip “unrecoverable” — only about six of the contracted 12 Lot 3 jets will arrive by the end of 2026 instead of all 12 in early 2026. Ongoing shortages of Elbit-built cockpit displays and GE F110 engines are compounding the delay.
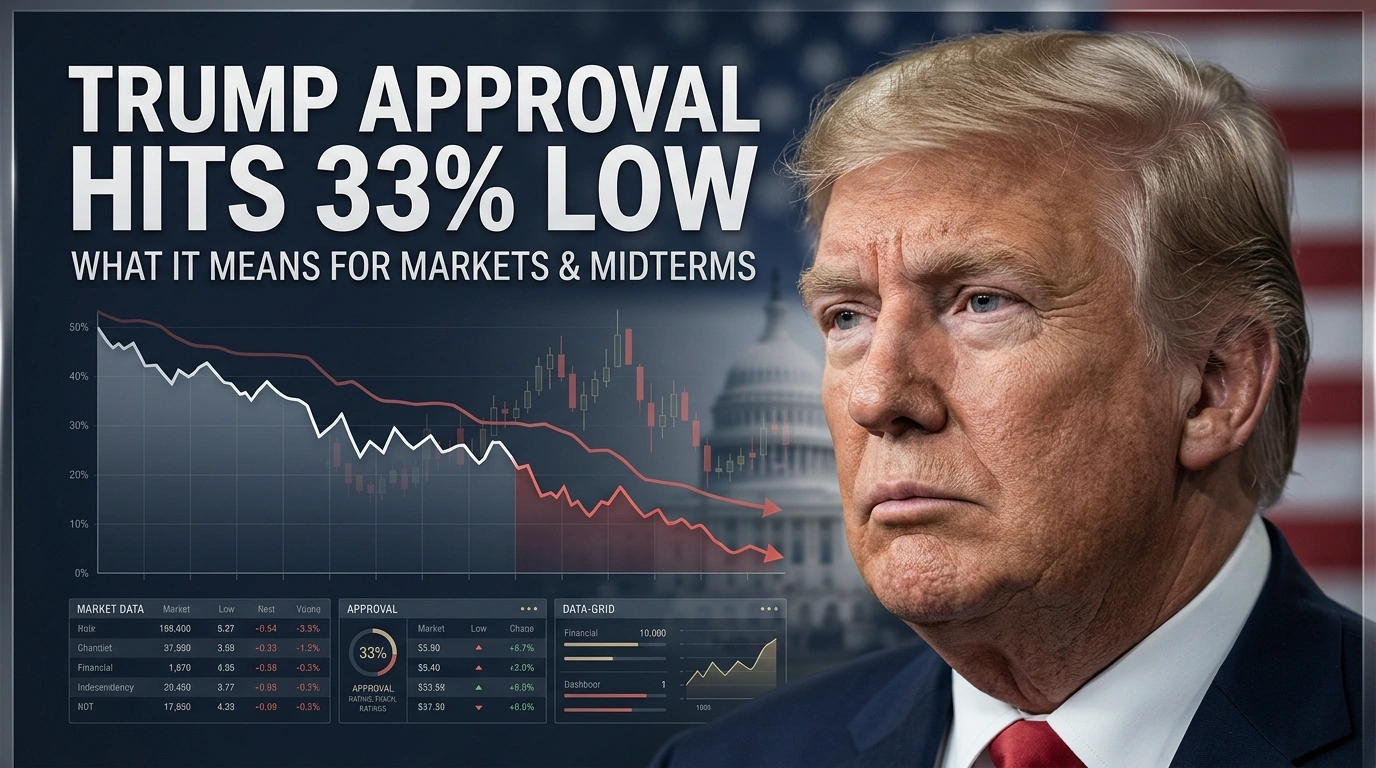
Trump’s approval rating has hit a second-term low of 33% in multiple polls this summer. Here’s what’s driving the decline, how it compares historically, and what it could mean for markets and the 2026 midterms.
Key Takeaways
- Trump’s approval rating has hit 33% in multiple independent polls this summer, including Reuters/Ipsos, The Economist/YouGov, and AP-NORC — a new low for his second term.
- The decline has been steep: Reuters/Ipsos polling shows a 14-point slide from 47% at the start of his second term to 33% now, with disapproval climbing from 41% to 65%.
- Polling averages remain somewhat higher than the lowest individual polls — the Decision Desk HQ average stood at 39.2%, illustrating the spread between different methodologies.
- The unpopular Iran conflict is a major drag: only 31% of Americans support continued U.S. military action, and 83% believe the conflict will continue for an extended period.
- Historical comparison is unfavorable: Trump’s current numbers trail his own first-term approval at the same point (41% in 2018) and are also below Biden’s comparable second-year approval (40% in August 2022).
Breaking Down the Numbers
Multiple independent polling organizations have converged on a similar, unflattering picture of President Trump’s standing heading into the 2026 midterms:
- Reuters/Ipsos: 33% approval, 65% disapproval (held steady across two consecutive surveys in mid-to-late August)
- The Economist/YouGov: 33% approval, a new low for that poll as of late August
- AP-NORC: 33% approval in a late-July survey — three points below Biden’s July 2022 approval and eight points below Trump’s own first-term July numbers
- Decision Desk HQ (DDHQ) average: 39.2%, the second-lowest since May, with 57.5% disapproving
The gap between the lowest individual polls (33%) and the polling average (around 39%) is a useful reminder for anyone tracking this story: individual polls can diverge meaningfully from methodology to methodology, and averages tend to smooth out the noise. Still, the consistent direction across virtually every major pollster — down, not up — is the more important signal than any single data point.
The Trajectory Matters as Much as the Level
According to Reuters/Ipsos tracking, Trump’s approval has fallen 14 points since the start of his second term, from 47% down to 33%, while disapproval has climbed 24 points, from 41% to 65%. That’s a significant and sustained erosion, not a single bad news cycle.
What’s Driving the Decline?
1. The Iran Conflict
An unpopular and prolonged U.S. military engagement with Iran is a significant drag on approval numbers:
- Only 31% of Americans support continued U.S. military action in Iran, down from 34% earlier in the summer and 37% in March.
- 83% of Americans believe the conflict will continue “for an extended period,” up from 80% earlier in the month — suggesting fatigue is building rather than easing.
- Approval of Trump’s handling of the Iran conflict specifically has declined even among Republicans, dropping from 71% to 61% in recent tracking, with just 48% of Republicans saying the U.S. should continue military action.
2. Economic Concerns
Polling context around the approval decline points to persistent economic anxiety among Americans as a contributing factor, compounding the foreign policy drag.
3. Historical Second-Term Pattern
Trump’s approval trajectory now trails not just his own first term, but also recent predecessors at comparable points:
| President | Approval at Comparable Point | Source |
|---|---|---|
| Trump (2026, second term) | 33% | Reuters/Ipsos |
| Trump (2018, first term, midterm year) | 41% | Reuters/Ipsos |
| Biden (August 2022) | 40% | Reuters/Ipsos |
Historical Context: What Happened Last Time Approval Was This Low Before a Midterm?
In the 2018 midterms — when Trump’s approval stood around 41%, notably higher than his current 33% — Republicans lost control of the House of Representatives, though the party gained two Senate seats. With his current approval running meaningfully below that benchmark, political analysts and Republican strategists are expressing heightened concern about the party’s ability to defend its congressional majorities in 2026.
Market and Investment Implications
Political Risk and Sector Exposure
Historically, periods of declining presidential approval heading into a midterm election can correlate with:
- Increased policy uncertainty premium in markets, particularly for sectors sensitive to potential legislative gridlock or shifts in regulatory posture.
- Elevated volatility in sectors tied to trade and foreign policy, given the Iran conflict’s direct role in the approval decline.
- Currency and bond market sensitivity to shifting expectations about fiscal policy continuity, particularly if control of Congress appears increasingly contested.
What History Suggests About Midterm-Year Market Performance
Markets have historically shown resilience through midterm election cycles regardless of which party is expected to gain seats, often pricing in political uncertainty well ahead of the actual vote. That said, sectors with direct regulatory or fiscal exposure — energy, defense, financial services, and healthcare — tend to see the most direct repricing around shifting congressional control expectations.
Actionable Takeaways for Investors and Political Observers
- Don’t overreact to a single poll. The spread between individual polls (33%) and polling averages (around 39%) illustrates why tracking multiple pollsters and trend direction matters more than any single headline number.
- Watch the Iran conflict closely as a specific, trackable driver of both approval numbers and potential market volatility — any de-escalation or further escalation is likely to move both simultaneously.
- Consider portfolio hedging strategies around sectors with direct regulatory exposure if you expect a competitive midterm environment to increase legislative gridlock risk.
- Track generic congressional ballot polling alongside presidential approval, as it offers a more direct read on likely House and Senate outcomes than approval ratings alone.
- Maintain a diversified portfolio rather than making concentrated bets based on political forecasting, given the inherent uncertainty in translating approval polling into specific electoral or market outcomes.
Frequently Asked Questions
What is Trump’s current approval rating? Multiple polls, including Reuters/Ipsos, The Economist/YouGov, and AP-NORC, have shown Trump’s approval rating at 33% as of late August 2026, while broader polling averages like Decision Desk HQ’s show a somewhat higher figure around 39%, reflecting the spread across different polling methodologies.
Why has Trump’s approval rating declined so much in 2026? Polling data points to an unpopular and prolonged U.S. military conflict with Iran, with only 31% of Americans supporting continued military action, alongside broader economic concerns, as significant contributing factors to the decline from 47% approval at the start of his second term to 33% now.
How might low presidential approval affect the stock market ahead of the midterms? Markets have historically shown general resilience through midterm election cycles, but sectors with direct regulatory or fiscal policy exposure — such as energy, defense, financial services, and healthcare — tend to experience more direct volatility around shifting expectations for congressional control, so investors may want to monitor generic ballot polling alongside approval ratings.

US Impeachment Talk and White House Press Secretary Changes: What the Record Shows

2026 Economic Outlook: Investment Tips for Pakistani Investors

Anduril’s $6.6 Billion Submarine Shipyard Plan Explained

Life Insurance Comparison: Term vs. Whole Life and What Each Actually Costs

Stock Market Today: Nasdaq Hits Record High as Dow and S&P 500 Stumble on Middle East Diplomatic Shifts

Energy Market Spikes vs. Consumer App Data: What GasBuddy and Crude Prices Signal for Inflation

China’s FTAAP Push for APEC 2026 in Shenzhen: US Tariffs and Unite Asia-Pacific

AI Stocks Slide After Industry Leaders Call for a Development Slowdown

Singapore Stocks vs. Japan Stocks: Safe Havens in the Asian Economic Slowdown

Agentic AI in Finance: How Artificial Intelligence Is Replacing Routine Tasks on Wall Street

Fiscal Deficit and Public Debt

T-Mobile’s Enterprise Push and the Evolution of Modern Corporate Mobility Solutions

Enterprise Generative AI ROI 2026: The Adoption-to-Impact Gap Explained

Climate Finance and the Economic Reality of Passing 1.5°C

Business Insurance for Digital Exports: Protecting Your Company in the AI Era

Real Estate Crash Predictions 2026: Data-Backed Regional Guide
Unrecoverable Delays: How the St. Louis Strike Crippled Boeing’s F-15EX Eagle II

What is a “Lead-Left” Bank? Unpacking Morgan Stanley’s Role in Anthropic’s Mega-IPO

How to Invest in the Anthropic IPO: Step-by-Step Guide for Retail Investors

Mario Kart 8 Deluxe 4.0.0 Patch Notes: 8-Player Split Screen & CameraPlay

Top 15 Stocks for Investment in 2026 in PSX: Your Complete Guide to Pakistan’s Best Investment Opportunities

Debunking IMF Program Myths: Reconfiguring Engagement for True National Ownership in a Volatile World

China Economy 2026: Property Crisis, AI Investment & Export Surplus Explained

Top 10 Mutual Fund Managers in Pakistan for Investment in 2026: A Comprehensive Guide for Optimal Returns

China’s 50% Domestic Equipment Rule: The Semiconductor Mandate Reshaping Global Tech

What the U.S. Attack on Venezuela Could Mean for Oil and Canadian Crude Exports: The Economic Impact

15 Most Lucrative Sectors for Investment in Pakistan: A 2025 Data-Driven Analysis

Pakistan’s Export Goldmine: 10 Game-Changing Markets Where Pakistani Businesses Are Winning Big in 2025

Pakistan’s Stock Market Renaissance: How 2025’s Hottest Investment Opportunity Is Democratizing Wealth—A Complete Beginner’s Guide
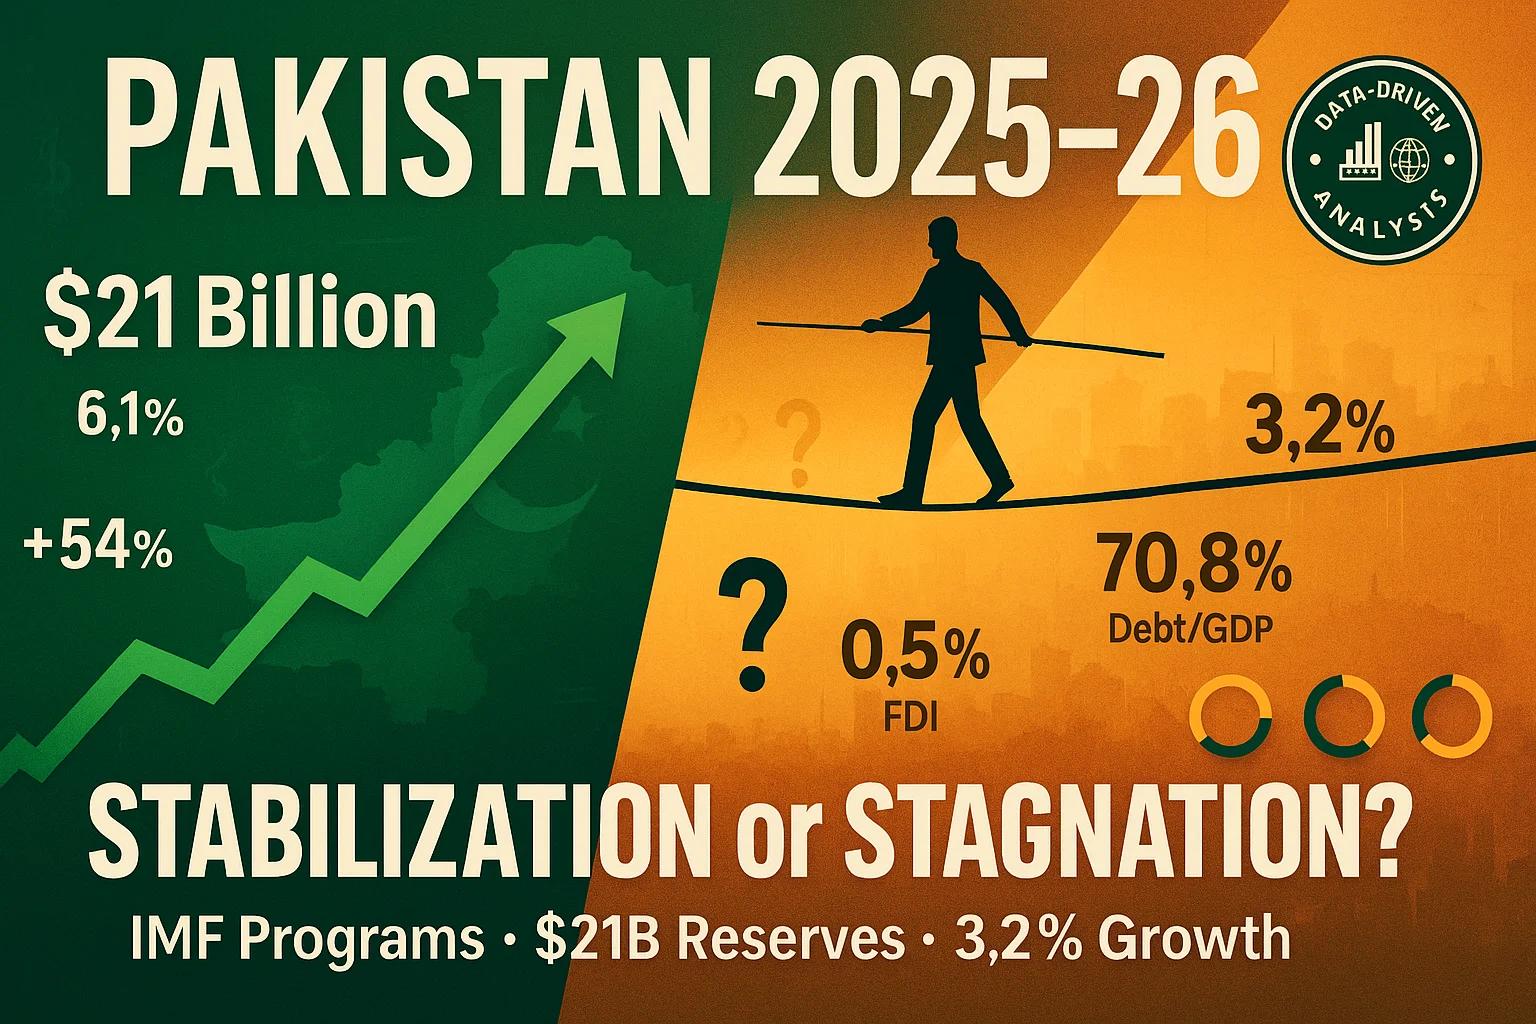
Pakistan’s Economic Outlook 2025: Between Stabilization and the Shadow of Stagnation

The Institutional Era: A Comprehensive Cryptocurrency Investment Analysis for 2026

China’s Property Woes Could Last Until 2030—Despite Beijing’s Best Censorship Efforts
Real Estate Crash Predictions 2026: Data-Backed Regional Guide

Best Investments in Pakistan 2026: Top 10 Low-Price Shares and Long-Term Picks for the PSX

How to Become an Active Taxpayer on Pakistan’s FBR Active Taxpayer List (ATL) in 2026: A Step-by-Step Guide

The Contours of 21st-Century Geopolitics Will Become Clearer in 2026: A New World Is Starting to Emerge

DBS Hits S$1 Billion AI Value Milestone — But Agentic AI Poses Talent Challenges for Singapore Banks

🌍 Davos 2026: The World Economic Forum Annual Meeting Sets the Stage for Global Transformation
Agentic AI in Finance: How Artificial Intelligence Is Replacing Routine Tasks on Wall Street

AI Impact on Wages 2026: Productivity Soars, Paychecks Stagnate
-
Markets & Finance10 months ago
Top 15 Stocks for Investment in 2026 in PSX: Your Complete Guide to Pakistan’s Best Investment Opportunities
-
Analysis9 months ago
Debunking IMF Program Myths: Reconfiguring Engagement for True National Ownership in a Volatile World
-
Analysis4 months ago
China Economy 2026: Property Crisis, AI Investment & Export Surplus Explained
-
Investment10 months ago
Top 10 Mutual Fund Managers in Pakistan for Investment in 2026: A Comprehensive Guide for Optimal Returns
-
Asia10 months ago
China’s 50% Domestic Equipment Rule: The Semiconductor Mandate Reshaping Global Tech
-
Global Economy10 months ago
What the U.S. Attack on Venezuela Could Mean for Oil and Canadian Crude Exports: The Economic Impact
-
AI10 months ago
15 Most Lucrative Sectors for Investment in Pakistan: A 2025 Data-Driven Analysis
-
Exports10 months ago
Pakistan’s Export Goldmine: 10 Game-Changing Markets Where Pakistani Businesses Are Winning Big in 2025